. 2006 Apr;80(8):4147-56.
doi: 10.1128/JVI.80.8.4147-4156.2006.

Cell cycle perturbations induced by infection with the coronavirus infectious bronchitis virus and their effect on virus replication

Affiliations

Cell cycle perturbations induced by infection with the coronavirus infectious bronchitis virus and their effect on virus replication

Brian Dove et al. J Virol. 2006 Apr.

Abstract

In eukaryotic cells, cell growth and division occur in a stepwise, orderly fashion described by a process known as the cell cycle. The relationship between positive-strand RNA viruses and the cell cycle and the concomitant effects on virus replication are not clearly understood. We have shown that infection of asynchronously replicating and synchronized replicating cells with the avian coronavirus infectious bronchitis virus (IBV), a positive-strand RNA virus, resulted in the accumulation of infected cells in the G2/M phase of the cell cycle. Analysis of various cell cycle-regulatory proteins and cellular morphology indicated that there was a down-regulation of cyclins D1 and D2 (G1 regulatory cyclins) and that a proportion of virus-infected cells underwent aberrant cytokinesis, in which the cells underwent nuclear, but not cytoplasmic, division. We assessed the impact of the perturbations on the cell cycle for virus-infected cells and found that IBV-infected G2/M-phase-synchronized cells exhibited increased viral protein production when released from the block when compared to cells synchronized in the G0 phase or asynchronously replicating cells. Our data suggested that IBV induces a G2/M phase arrest in infected cells to promote favorable conditions for viral replication.


Figures
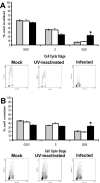
FIG.1.
FIG.1.
IBV-induced G2/M phase arrest is dependent upon the presence of replication-competent virus. Histogram of the mean percentage of mock-infected (gray), UV-inactivated-virus-infected (white), and IBV-infected (black) cells in the G0/G1, S, and G2/M phases of the cell cycle after 24 h postinfection (±standard deviations). Significant differences between the numbers of IBV-infected G2/M cells and the corresponding numbers of mock-infected and UV-inactivated-virus-infected cell controls for Vero (P < 0.001, n = 3) and BHK (P < 0.05, n = 3) are indicated by an asterisk. Similar results were obtained from three independent experiments. Representative dual-stained BrdU/PI cell cycle profiles are shown for mock-infected, UV-inactivated-virus-infected, and IBV-infected Vero (A) and BHK (B) cells at 24 p.i. (the x axis is the intensity of PI staining, and the y axis is the intensity of BrdU staining). (C and D) To ensure UV-inactivated IBV was incapable of replication or protein synthesis, cellular RNA and protein were isolated from mock-infected (lane 1), UV-inactivated-virus-infected (lane 2), and IBV-infected Vero cells (lane 3) and examined by (C) RT-PCR and (D) Western blotting for the presence of IBV N protein. The detection of GAPDH mRNA (C) and protein (D) was used as a control. Lane 4 in panel C is a negative control for RT-PCR.
FIG.1.
FIG.1.
IBV-induced G2/M phase arrest is dependent upon the presence of replication-competent virus. Histogram of the mean percentage of mock-infected (gray), UV-inactivated-virus-infected (white), and IBV-infected (black) cells in the G0/G1, S, and G2/M phases of the cell cycle after 24 h postinfection (±standard deviations). Significant differences between the numbers of IBV-infected G2/M cells and the corresponding numbers of mock-infected and UV-inactivated-virus-infected cell controls for Vero (P < 0.001, n = 3) and BHK (P < 0.05, n = 3) are indicated by an asterisk. Similar results were obtained from three independent experiments. Representative dual-stained BrdU/PI cell cycle profiles are shown for mock-infected, UV-inactivated-virus-infected, and IBV-infected Vero (A) and BHK (B) cells at 24 p.i. (the x axis is the intensity of PI staining, and the y axis is the intensity of BrdU staining). (C and D) To ensure UV-inactivated IBV was incapable of replication or protein synthesis, cellular RNA and protein were isolated from mock-infected (lane 1), UV-inactivated-virus-infected (lane 2), and IBV-infected Vero cells (lane 3) and examined by (C) RT-PCR and (D) Western blotting for the presence of IBV N protein. The detection of GAPDH mRNA (C) and protein (D) was used as a control. Lane 4 in panel C is a negative control for RT-PCR.
FIG. 2.
FIG. 2.
Representative dual-stained BrdU/PI cell cycle profiles for mock- and IBV-infected Vero cells at 0, 4, 8, 12, 16, 20, and 24 h postinfection. Representative cell cycle profiles for mock- and IBV-infected Vero cells are shown to the left (the x axis is the intensity of PI staining, and the y axis is the intensity of BrdU staining).
FIG. 3.
FIG. 3.
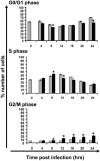
IBV induces a G2/M phase arrest in Vero cells. Cell cycle profiles for dual-stained BrdU/PI cells were analyzed by CellQuest software. Histogram bars represent the mean percentages of cells in the G0/G1, S, and G2/M phases of the cell cycle at 0, 4, 8, 12, 16, 20, and 24 h postinfection in mock-infected (gray) and IBV-infected (black) cells (±standard deviations). Significant differences (P < 0.01, n = 3) between data sets are indicated by an asterisk.
FIG. 4.
FIG. 4.
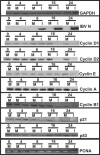
Western blot analysis of total cellular protein isolated from mock (M)- and IBV-infected (I) Vero cells at 0, 4, 8, 16, and 24 h postinfection. Protein amounts were standardized as shown with GAPDH. Viral protein accumulation was confirmed by the detection of N protein, and several different proteins involved in various aspects of cell cycle control were analyzed, including G1 cyclins (cyclins D1 and D2), a protein involved in G1-to-S-phase progression (cyclin E), S phase (cyclin A and PCNA) and G2/M (cyclin B1) proteins, and regulatory factors p21 and p53. This experiment was repeated three times, and representative blots are shown.
FIG. 5.
FIG. 5.
Vero cells were infected with IBV and imaged using confocal microscopy. Two examples of infected cells displaying aberrant cytokinesis are shown (A to D and F to I). Viral proteins were labeled with the appropriate antibody and FITC and are shown in green (A and F), corresponding nuclei and nucleoli are stained with PI (red) (B and G), and the two images were superimposed (C and H). In addition, the corresponding bright-field images for the cells are depicted underneath (D and I). For orientation, in panels F and G, the nucleoli are denoted No and the cleavage furrow CF. Z-phase reconstruction was used to generate a section through the cell shown in panel C (E). For reference, the boundary of the nuclei is denoted B1 and B2, with the cleavage furrow as CF. The horizontal white line bisectioning the cell shown in panel C denotes the focal plane of the section. Magnification of all images is ×340. (J) PI staining of a cell undergoing normal nuclear division. (K) Corresponding bright-field image. (L and M) IBV-infected cells displaying aberrant cytokinesis, with IBV proteins labeled in green and p53 in red. CF, cleavage furrow.
FIG. 6.
FIG. 6.
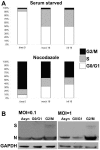
(A) Cell cycle profiles of cells arrested in either the G1 phase using serum starvation or the M phase using nocodazole. Following synchronization (time zero) cells were released from block and simultaneously mock infected and infected, and cell cycle profiles were analyzed 16 h later (mock 16 and inf 16, respectively). The y axis is the percentage of cells in the indicated phase of the cell cycle. The histograms show the means of three samples; similar results were obtained from three independent experiments. (B) Western blot analysis of viral proteins 16 h postinfection and release in asynchronously replicating cells (Asyn) and cells in G0/G1 and G2/M blocked using serum starvation and nocodazole, respectively. Using the polyclonal anti-IBV antibody the N protein can be readily identified as well as the S protein.
FIG. 7.
FIG. 7.
Cell cycle profiles of cells arrested at the G1/S phase border using double-thymidine treatment (n = 3). Following synchronization (time zero) cells were released from block and simultaneously mock infected and infected, and cell cycle profiles were analyzed at 12, 16, and 19 h p.i. (indicated below the appropriate bar). There was a significant increase in the number of IBV-infected cells in the G2/M phase of the cell cycle compared to mock-infected cells at 12 h p.i. (P < 0.05, n = 3) and both 16 and 19 h p.i. (P < 0.01, n = 3). The y axis is the percentage of cells in the indicated phase of the cell cycle. Similar results were obtained from three independent experiments.
FIG. 8.
FIG. 8.
Diagrammatic representation of the length of each cell cycle stage in asynchronously cycling Vero cells. G1 phase (white) takes approximately 12 h), S phase (gray) takes approximately 6 h, and G2 and M phases (black) take approximately 2 and 1 h to complete, respectively. The points in the cell cycle where serum starvation (S), the double-thymidine block (T), and nocodazole (N) block the cell cycle are indicated. On the outside is indicated where in the cell cycle synchronously replicating cells reach when released from their appropriate block.

Similar articles

Cited by

References

    1. Alonso-Caplen, F. V., Y. Matsuoka, G. E. Wilcox, and R. W. Compans. 1984. Replication and morphogenesis of avian coronavirus in Vero cells and their inhibition by monensin. Virus Res. 1:153-167. - PMC - PubMed
    1. Casais, R., B. Dove, D. Cavanagh, and P. Britton. 2003. Recombinant avian infectious bronchitis virus expressing a heterologous spike gene demonstrates that the spike protein is a determinant of cell tropism. J. Virol. 77:9084-9089. - PMC - PubMed
    1. Chau, T. N., K. C. Lee, H. Yao, T. Y. Tsang, T. C. Chow, Y. C. Yeung, K. W. Choi, Y. K. Tso, T. Lau, S. T. Lai, and C. L. Lai. 2004. SARS-associated viral hepatitis caused by a novel coronavirus: report of three cases. Hepatology 39:302-310. - PMC - PubMed
    1. Chen, C. J., and S. Makino. 2004. Murine coronavirus replication induces cell cycle arrest in G0/G1 phase. J. Virol. 78:5658-5669. - PMC - PubMed
    1. Chen, C. J., K. Sugiyama, H. Kubo, C. Huang, and S. Makino. 2004. Murine coronavirus nonstructural protein p28 arrests cell cycle in G0/G1 phase. J. Virol. 78:10410-10419. - PMC - PubMed

Publication types

LinkOut - more resources