Comparative Study
. 2006 Jun 1;496(4):495-512.
doi: 10.1002/cne.20938.

Development of callosal topography in visual cortex of normal and enucleated rats

Affiliations
Comparative Study

Development of callosal topography in visual cortex of normal and enucleated rats

Jaime F Olavarria et al. J Comp Neurol. .

Abstract

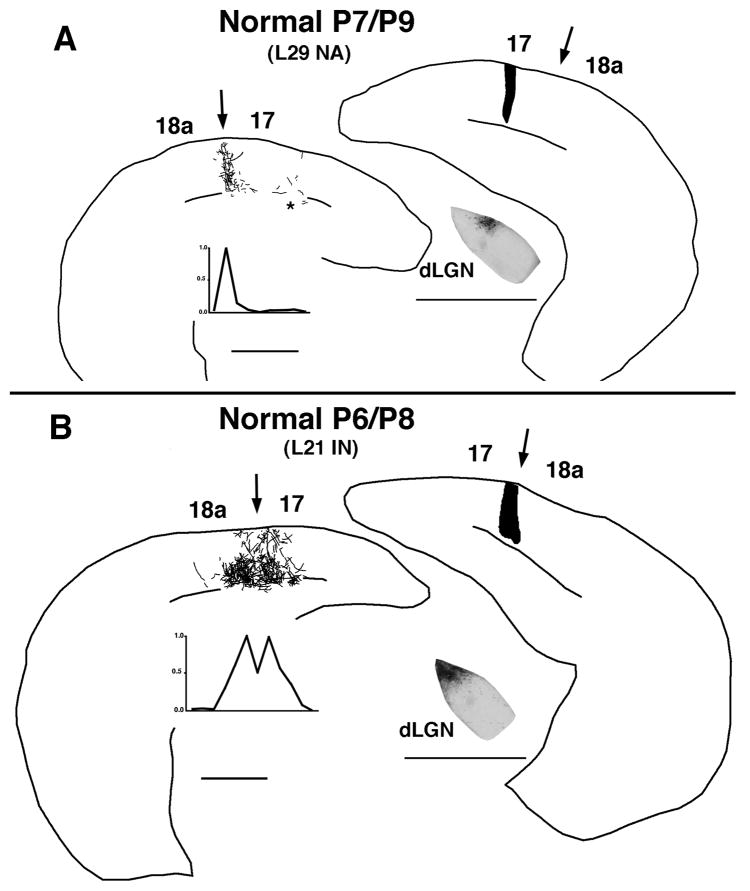
In normal rats callosal projections in striate cortex connect retinotopically corresponding, nonmirror-symmetric cortical loci, whereas in rats bilaterally enucleated at birth, callosal fibers connect topographically mismatched, mirror-symmetric loci. Moreover, retina input specifies the topography of callosal projections by postnatal day (P)6. To investigate whether retinal input guides development of callosal maps by promoting either the corrective pruning of exuberant axon branches or the specific ingrowth and elaboration of axon branches at topographically correct places, we studied the topography of emerging callosal connections at and immediately after P6. After restricted intracortical injections of anterogradely and retrogradely transported tracers we observed that the normal, nonmirror-symmetric callosal map, as well as the anomalous, mirror-symmetric map observed in neonatally enucleated animals, are present by P6-7, just as collateral branches of simple architecture emerge from their parental axons and grow into superficial cortical layers. Our results therefore do not support the idea that retinal input guides callosal map formation by primarily promoting the large-scale elimination of long, nontopographic branches and arbors. Instead, they suggest that retinal input specifies the sites on the parental axons from which interstitial branches will grow to invade middle and upper cortical layers, thereby ensuring that the location of invading interstitial branches is accurately related to the topographical location of the soma that gives rise to the parental axon. Moreover, our results from enucleated rats suggest that the cues that determine the mirror-symmetric callosal map exert only a weak control on the topography of fiber ingrowth.


Figures

Fig. 1
Fig. 1
A: Diagram of the distribution of callosal connections in areas 17 and 18a in rat visual cortex produced by multiple tracer injections in the contralateral cortex. Gray areas correspond to cortical regions containing dense accumulations of callosal connections. The borders of area 17 are indicated by arrows. In the medial callosal region (MCR), labeled callosal cells are located preferentially in infragranular layers. The MCR extends from the medial border of area 17 to the medial edge (indicated by the bar) of the column-like accumulation of callosal connections at the 17/18a border region. The lateral callosal region (LCR) includes the portion of the 17/18a callosal zone that lies within striate cortex, excluding, therefore, the portion of this zone located in area 18a. In the LCR, callosal cells are distributed most densely in layers 2/3, 5a, 5c and 6a, less densely in layers 4, 5b and the remainder of layer 6, and are virtually absent in layer 1 (Olavarria and Van Sluyters, 1985; Olavarria et al., 1987). B: Diagram of the rat brain indicating the locations of areas 17 and 18a in occipital cortex, the injection sites on the right hemisphere (black dots), and the coronal level from which section in A was taken (horizontal line).
Fig. 2
Fig. 2
Organization of callosal linkages revealed with retrogradely transported tracers in the LCR of normal pups. A: Pup injected on P6 and perfused on P7 (P6/P7, case L8J). This case received an injection of red beads (RB, indicated in gray in right panel) at the 17/18 border, and an injection of green beads (GB, indicated in black in right panel) placed about 650 μm more medially. Arrows indicate the 17/18a border. Top right inset illustrates the approximate location, relative to the border of area 17, of the injection sites (right), and of the corresponding labeled fields in the opposite hemisphere (left). At left, drawings show the distribution of GB-labeled cells (black dots, middle drawing) and RB-labeled cells (gray dots, bottom drawing) reconstructed from coronal sections taken from the region indicated by the parallel lines in top inset. These labeling patterns are superimposed in the top drawing. Labeled cells were observed throughout cortical layers 2–6. The asterisk in the middle drawing marks the location of a cluster of GB-labeled cells located in more medial portions of area 17 (presumptive MCR). The GB injection may have encroached onto the MCR, and these cells probably reflect the mirror-symmetric projection of the MCR. The relative locations of the RB- and GB-labeled cells in the LCR are represented in the bottom left graph. The curve for RB-labeling represents the distribution of RB-labeled cells located within area 17 and medial area 18a; the total numbers of RB- and GB-labeled cells counted are indicated. Bottom right inset illustrates the location of the labeled fields in the dorsal lateral geniculate nucleus (dLGN; medial is to the left). The location of labeled fields produced by the respective tracers in the ipsilateral LGN confirms the location of the injection sites in area 17. Scale bars = 1.00 mm. B: Pup injected on P8 and perfused on P9 (P8/P9, case L7B2). This case received an injection of red beads (RB, indicated in gray in right panel) at the 17/18 border, and an injection of green beads (GB, indicated in black in right panel) placed about 400 μm more medially. Other conventions as in A.
Fig. 3
Fig. 3
Organization of callosal linkages revealed with retrogradely transported tracers in pups enucleated at birth and injected on P6 and perfused on P7 (case L22B). This case received an injection of red beads (RB, indicated in gray in right panel) at a location medial to the 17/18 border, and an injection of green beads (GB, indicated in gray in right panel) placed about 410 μm further medially. Injections sites are shown in Fig. 4C. Top right inset illustrates the approximate location, relative to the border of area 17, of the injection sites (right), and of the corresponding labeled fields in the opposite hemisphere (left). At left, drawings show the distribution of GB-labeled cells (black dots, top drawing) and RB-labeled cells (gray dots, bottom drawing) reconstructed from coronal sections taken from the region indicated by the parallel lines in top inset. Labeled cells were observed throughout cortical layers 2–6. The relative locations of the RB- and GB-labeled cells in the LCR are represented in the bottom left graph. The total numbers of RB- and GB-labeled cells counted are indicated. Bottom right inset illustrates the location of the labeled fields in the dorsal lateral geniculate nucleus (dLGN; medial is to the left). The location of labeled fields produced by the respective tracers in the ipsilateral LGN confirms the location of the injection sites in area 17. Scale bars = 1.00 mm.
Fig. 4
Fig. 4
Low (A) and high (B) power, bright-field views of Nissl-stained sections showing cytoarchitecture of posterior neocortex at P6 in normal rats. Arrow in B marks position at which the staining density in layer IV decreases upon passing from area 17 to area 18a. Cortical layers are indicated in B. Scale bars = 1.00 mm. C,D: Images of cortical injections of fluorescent tracers green beads (GB) and red beads (RB) in cases 22 B (C) and 22 C (D). Top edge of black background corresponds to the pia matter, while bottom edge corresponds to the border between gray and white matter. Data from case 22B (C) are shown in Fig. 3. Scale bar = 1.00 mm.
Fig. 5
Fig. 5
Organization of callosal projections revealed with the anterogradely transported tracer BDA in the lateral callosal region of normal pups injected on P4 and perfused on P6. A: Pup (case L46 NC) that received two adjacent injections of BDA at locations medial to the prospective 17/18a border. A: drawing and a low-power micrograph of the injections are shown in the top and bottom panels at right, respectively. At left, drawing shows the distribution of BDA-labeled fibers reconstructed from coronal sections. The asterisk marks the location of labeled fibers located in more medial portions of area 17 (presumptive MCR). The BDA injections may have encroached onto the MCR, and these fibers probably reflect the mirror-symmetric projection of the MCR. The distribution of labeling density is represented in the bottom left graph. Bottom right inset shows an outline of the anterogradely labeled field in the right dorsal lateral geniculate nucleus (dLGN; medial is to the left). The location of labeled field produced by the BDA injection in the ipsilateral LGN confirms the location of the injection sites in area 17. Scale bars = 1.00 mm. B: In this case (L46 NA), the BDA injection was placed at the 17/18a border. Conventions as in A.
Fig. 6
Fig. 6
Organization of callosal projections revealed with the anterogradely transported tracer BDA in the lateral callosal region of normal pups injected on P4 and perfused on P6. Cases additional to those shown in Fig. 5 further illustrate the patterns of callosal axons labeled after injections of BDA placed medial to the 17/18a border (A) or on the 17/18a border (B). The asterisk in A marks the location of labeled fibers located in more medial portions of area 17 (presumptive MCR). The BDA injections may have encroached onto the MCR, and these fibers probably reflect the mirror-symmetric projection of the MCR. Low-power micrographs at bottom right show BDA-labeled fields (arrowheads) in the dLGN ipsilateral to the injections. Other conventions as in Fig. 5.
Fig. 7
Fig. 7
Organization of callosal projections revealed with the anterogradely transported tracer BDA in the lateral callosal region of normal pups injected on P6–7 and perfused on P8–9. A: Case (L29 NA) injected on P7 and perfused on P9. The BDA injection was placed at a location medial to the 17/18a border (right panel). At left, drawing shows the distribution of BDA-labeled fibers reconstructed from coronal sections. The asterisk marks the location of labeled fibers located in more medial portions of area 17 (presumptive MCR). The BDA injections may have encroached onto the MCR, and these fibers probably reflect the mirror-symmetric projection of the MCR. The distribution of labeling density is represented in the bottom left graph. Low-power micrograph shows the location of the anterogradely labeled field (area of dark labeling) in the right dorsal lateral geniculate nucleus (dLGN; medial is to the left). Scale bars = 1.00 mm. B: Case (L21 IN) injected on P6 and perfused on P8. In this case the BDA injection was placed at the 17/18a border, as confirmed by the pattern of dLGN labeling shown in the low-power micrograph at bottom right. Other conventions as in A.
Fig. 8
Fig. 8
Organization of callosal projections revealed with the anterogradely transported tracer BDA in pups enucleated at birth. Tracer injections on P4 and perfusion on P6. A: Pup (case L42–3A) that received an injection of BDA at a location medial to the prospective 17/18a border. Right panels show drawing (top) and low-power micrograph (bottom) of injection site. At left, drawing shows the distribution of BDA-labeled fibers reconstructed from coronal sections. Labeled fibers were observed throughout cortical layers 1–6. The distribution of labeling density is represented in the bottom left graph. Bottom right inset illustrates the location (outline) of the anterogradely labeled field in the right dorsal lateral geniculate nucleus (dLGN; medial is to the left). Scale bars = 1.00 mm. B: In this case (L44), the BDA injection was placed at the 17/18a border. Other conventions as in A.
Fig. 9
Fig. 9
Organization of callosal projections revealed with the anterogradely transported tracer BDA in pups enucleated at birth. Tracer injection on P6 and perfusion on P8. A: Pup (case L22F) that received an injection of BDA at a location medial to 17/18a border. Right panels show drawing (top) and low-power micrograph (bottom) of injection site. At left, drawing shows the distribution of BDA-labeled fibers reconstructed from coronal sections. The distribution of labeling density is represented in the bottom left graph. Bottom right inset illustrates the location (outline) of the anterogradely labeled field in the right dorsal lateral geniculate nucleus (dLGN; medial is to the left). Scale bars = 1.00 mm. B: In this case (L27A), the BDA injection was placed closer to the 17/18a border than in the case shown in A. Drawing at left shows the distribution of BDA-labeled fibers reconstructed from coronal sections. Graph (black line) at bottom left shows the distribution of labeling density. Graph from A (gray line) has been superimposed for comparison. Other conventions as in A.
Fig. 10
Fig. 10
A: Comparison of the sizes of the callosal fields in normal (black bars) and in enucleated (gray bar) rats. For each animal, the size of the callosal field corresponds to the half-width of the distribution of callosal labeling density. The means and SEM are graphed. In normal animals, the size of the callosal fields resulting from BDA injections located medial to the 17/18a border (left black bar) are significantly smaller (P < 0.01) than the size of the fields resulting from BDA injections on the 17/18a border (right black bar). The size of callosal fields in enucleated animals (gray bar) are significantly larger (P < 0.01) than the fields in normal animals. B: Scatter plot correlating the width of the callosal fields with the location of the injection sites in area 17 of normal (black dots), and enucleated (gray dots) pups. The location of the injection sites in area 17 was estimated from the pattern of BDA labeling in the dLGN ipsilateral to the cortical injections (see Materials and Methods).
Fig. 11
Fig. 11
Overall distribution of callosal projections revealed after multiple injections of the anterogradely transported tracer BDA in normal pups. Drawings illustrate the distribution of BDA-labeled callosal fibers in representative coronal sections in a case injected at P2 and perfused at P4 (top drawing), and in a case injected at P3 and perfused at P5 (bottom drawing). Medial is to the right. The location of presumptive area 17 is indicated in the bottom drawing. Cortical layers are indicated at left. CP = cortical plate; scale bar = 1.00 mm.
Fig. 12
Fig. 12
Diagram illustrates hypothesis regarding the emergence of callosal maps. The top panels in A and B summarize the development of callosal projections observed by P6 in both normal (A) and bilaterally enucleated (B) animals. The arrows mark the location of area 17. At right, injections placed at the 17/18a border and medial to it are represented in black and gray, respectively. At left, the corresponding colors are used to represent the patterns of callosal interstitial branches labeled by each tracer. These diagrams illustrate that both the normal (non-mirror symmetric, A), as well as the abnormal (mirror symmetric, B) callosal maps are present by P6. Middle panels in A and B illustrate the emergence of long interstitial branches from 3 representative callosal cells labeled by each tracer. In normal animals (middle panel in A), our results suggest that retinal input specifies the sites on the parental axons from which interstitial branches will grow to invade middle and upper cortical layers. Retinal input would ensure that the location where invading interstitial branches form on the parental axon is accurately related to the topographical location of the soma that gives rise to the parental axon. Note that interstitial branches in 18a in the normal animal are not connected to parental axons to indicate that, at present, it is not known whether single parental axons can give rise to branches on either side of the 17/18a border. In enucleated animals (middle panel in B), our results suggest that the cues that determine the mirror-symmetric callosal map in enucleated pups exert only a weak control on the topography of fiber ingrowth. These cues would only establish a loose relationship between the emergence sites of long side branches and the actual position of the cell soma in the contralateral hemisphere. Bottom panels in A and B represent the relative distributions of axons labeled by each tracer.

Similar articles

Cited by

References

    1. Aggoun-Zouaoui D, Innocenti GM. Juvenile visual callosal axons in kittens display origin-and fate-related morphology and distribution of arbors. Eur J Neurosci. 1994;6:1846–1863. - PubMed
    1. Agmon A, Yang LT, O’Dowd DK, Jones EG. Organized Growth of thalamocortical axons from the deep tier of terminations into layer IV of developing mouse barrel cortex. J Neurosci. 1993;13:5365–5382. - PMC - PubMed
    1. Agmon A, Yang LT, Jones EG, O’Dowd DK. Topological precision in the thalamic projection of neonatal mouse barrel cortex. J Neurosci. 1995;15:549–565. - PMC - PubMed
    1. Alsina B, Vu T, Cohen-Cory S. Visualizing synapse formation in arborizing optic axons in vivo: dynamics and modulation by BDNF. Nat Neurosci. 2001;4:1093–1101. - PubMed
    1. Barone P, Dehay C, Berland M, Kennedy H. Role of directed growth and target selection in the formation of cortical pathways: prenatal development of the projection of area V2 to area V4 in the monkey. J Comp Neurol. 1996;374:1–20. - PubMed

Publication types