

doi: 10.3758/bf03193178.
Does satiation close the open economy?
Affiliations
- PMID: 16573210
- PMCID: PMC1456067
- DOI: 10.3758/bf03193178
Item in Clipboard
Does satiation close the open economy?
Learn Behav.
2005 Nov.
Abstract
Pigeons responded on fixed-interval and fixed-ratio food schedules during sessions of extended duration. Pause lengths from the beginning of the session, when the subjects were hungry, resembled those found in open economies, whereas pause lengths from the end of the sessions, when the subjects were close to satiation, resembled those from closed economies. A model of motivation captured key features of the data, suggesting that a changing level of hunger is a causal factor in the behavioral differences observed between open and closed economies. Behavioral theories may provide a parsimonious alternative to economic theories in accounting for such effects.
Figures
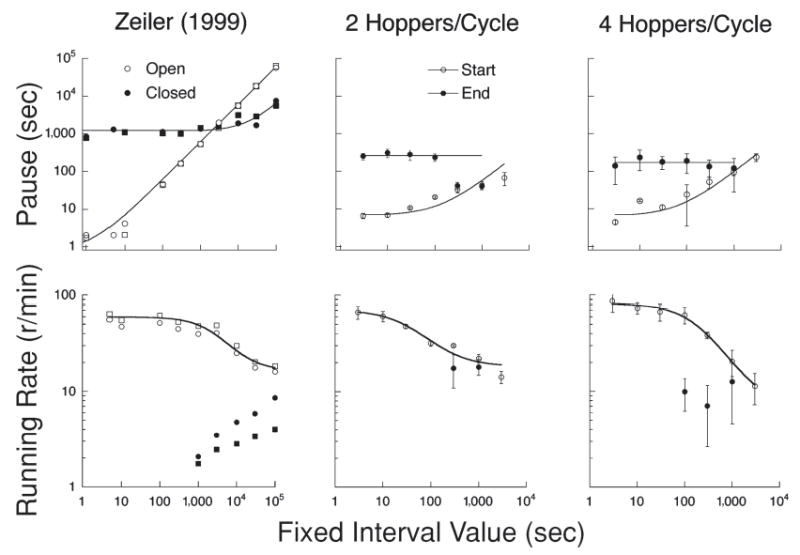
Initial pause durations (top panel) and run rates (bottom panel) as a function of the fixed-interval (FI) schedules. First column: data from 2 pigeons in Zeiler (1999). Open symbols represent the performance under open economies, giving smaller amounts of grain per reinforcer and some postsession feeding. Closed symbols represent the performance under closed economies, with 24-h sessions and ad lib amounts of grain per reinforcer. The remaining columns show the data from Experiments 1 and 2. Open symbols represent the average performance from the first 25 cycles in the session, and closed symbols the average from the last 25 cycles. Data are averages over 4 (second column) or 6 (third column) pigeons. Error bars span the interquartile range. The curves are derived from Equation 5 (pauses) and Equations 3–4.1 (response rates), with the parameters listed in Table 2. Data for rates are reported only when at least 20 trials contained measurable rates. Given the very long pauses in Zeiler’s (1999) closed economy and in our end-of-session conditions, most trials at the shorter FI values contained only a single response.
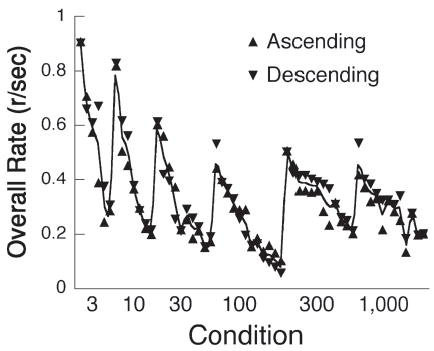
Average response rates over pigeons from ascending (up arrow) and descending (down arrow) conditions in Experiment 1, in blocks of trials. The lines connect the average of ascending and descending blocks. The first six pairs of points represent the data from the fixed-interval (FI) 3-sec condition, the next set from the FI 10-sec condition, and so on.
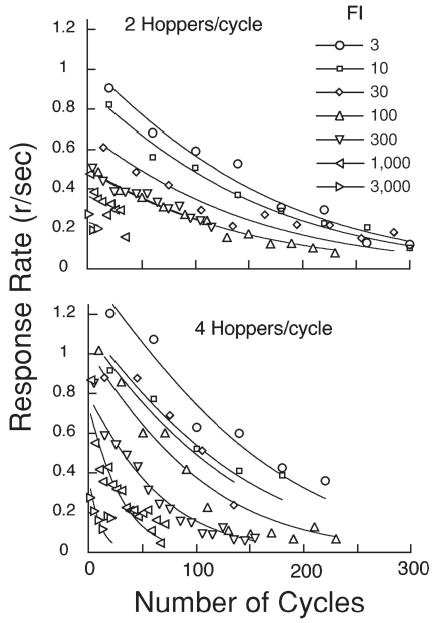
Satiation curves for pigeons receiving two hoppers/cycle (Experiment 1) or four hoppers/cycle (Experiment 2). The data are overall response rates from successive blocks of cycles. The curves are from Equation 2, with hunger (and thus a) assumed to decrease exponentially as a function of the number of hoppers. The y-intercept of these curves increases with the rate of reinforcement (compare curves within panels) and magnitude of reinforcement (compare curves across panels), reflecting the quantitative law of effect typical of open economies.
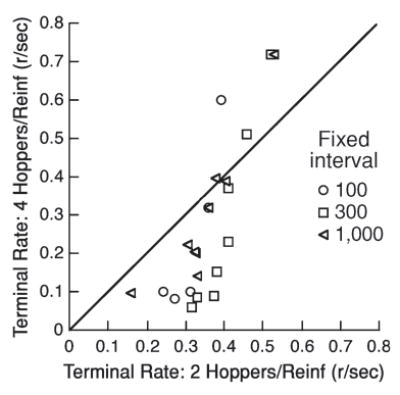
Terminal (running) rates in successive blocks of reinforcement for the pigeons in the four hoppers/cycle condition are plotted against those in the two hoppers/cycle condition. The blocks comprised 10 cycles for the FI 100 condition, 5 for FI 300, and 4 for FI 1,000. Rates above the diagonal issue from the start of the session and reflect faster responding in the four hoppers/cycle condition; rates below the diagonal are from the end of the session and reflect slower responding in the four hoppers/cycle condition.
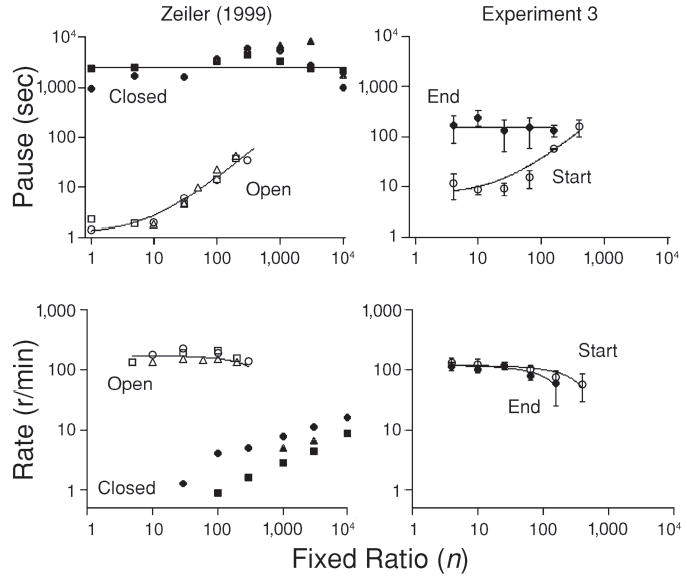
Initial pause duration (top row) and run rate (bottom row) as a function of the fixed-ratio (FR) schedules for Zeiler (1999; left column) and Experiment 3 (right column). Open circles represent the average of the first 25 reinforcer cycles for the FR in Experiment 3; closed circles represent the average of the last 25 cycles. The curves assume pause to be a linear function of ratio value. Response rates are from Equations 3 and 4.1, with the parameters in Table 1.
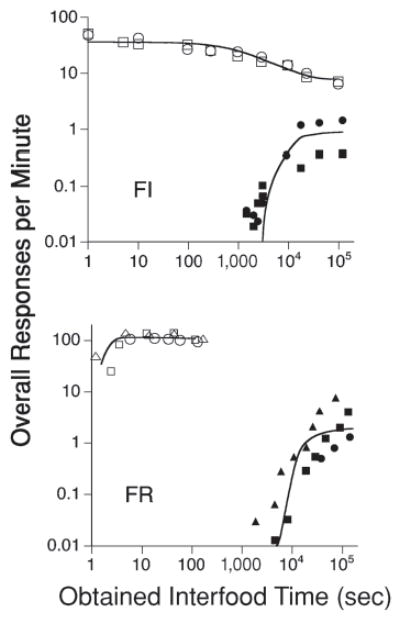
Overall response rates reported by Zeiler (1999) as a function of the obtained interfood intervals. The curves are given by Equations 3–5, with the parameters shown in Table 2.
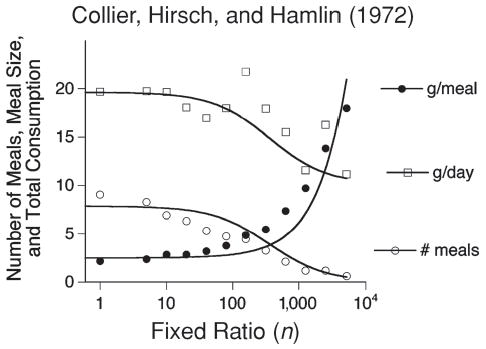
Median data from 3 rats as a function of ratio size in a closed economy, extracted from Collier (1986). The ascending curve assumes that meal size (MS) is a linear function of time since the last meal (measured as the fixed-ratio value) MS = d0 + mn (Equation 5), with d0 = 3 g and m = 0.0035 g. The number of meals (circles) is found by dividing the number of seconds in 24 h by the expected interfood interval: IFI = P0 + kn, with P0 = 11,000 sec and k = 30 sec.
Similar articles
-
Behavioral economics and within-session changes in responding.J Exp Anal Behav. 1999 Nov;72(3):355-71. doi: 10.1901/jeab.1999.72-355. J Exp Anal Behav. 1999. PMID: 10605103 Free PMC article.
-
On the distinction between open and closed economies.J Exp Anal Behav. 1987 Jul;48(1):35-60. doi: 10.1901/jeab.1987.48-35. J Exp Anal Behav. 1987. PMID: 3625103 Free PMC article.
-
The effects of component duration on multiple-schedule performance in closed and open economies.J Exp Anal Behav. 1988 Nov;50(3):457-68. doi: 10.1901/jeab.1988.50-457. J Exp Anal Behav. 1988. PMID: 3209960 Free PMC article.
-
Pause relationships in multiple and chained fixed-ratio schedules.J Exp Anal Behav. 1968 Mar;11(2):117-26. doi: 10.1901/jeab.1968.11-117. J Exp Anal Behav. 1968. PMID: 5645867 Free PMC article.
-
The effect of economy type on reinforcer value.Behav Processes. 2019 May;162:20-28. doi: 10.1016/j.beproc.2019.01.008. Epub 2019 Jan 24. Behav Processes. 2019. PMID: 30685410 Free PMC article. Review.
Cited by
-
Effect of quinolinic acid-induced lesions of the subthalamic nucleus on performance on a progressive-ratio schedule of reinforcement: a quantitative analysis.Behav Brain Res. 2008 Dec 22;195(2):223-30. doi: 10.1016/j.bbr.2008.09.005. Epub 2008 Sep 18. Behav Brain Res. 2008. PMID: 18840473 Free PMC article.
-
The effects of session length on demand functions generated using FR schedules.J Exp Anal Behav. 2011 May;95(3):289-304. doi: 10.1901/jeab.2011.95-289. J Exp Anal Behav. 2011. PMID: 21547068 Free PMC article.
-
Heroin choice depends on income level and economy type.Psychopharmacology (Berl). 2020 May;237(5):1447-1457. doi: 10.1007/s00213-020-05471-6. Epub 2020 Jan 29. Psychopharmacology (Berl). 2020. PMID: 31993695 Free PMC article.
-
The Risky Closed Economy: A Holistic, Longitudinal Approach to Studying Fear and Anxiety in Rodents.Front Behav Neurosci. 2020 Oct 23;14:594568. doi: 10.3389/fnbeh.2020.594568. eCollection 2020. Front Behav Neurosci. 2020. PMID: 33192372 Free PMC article.
-
Rats' performance in a suboptimal choice procedure implemented in a natural-foraging analogue.Anim Cogn. 2024 Nov 1;27(1):72. doi: 10.1007/s10071-024-01913-2. Anim Cogn. 2024. PMID: 39485623 Free PMC article.
References
-
- Aoyama K. Within-session response rate in rats decreases as a function of amount eaten. Physiology & Behavior. 1998;64:765–769. - PubMed
-
- Aoyama K. Effects of hunger state on within-session response decreases under CRF schedule. Learning & Motivation. 2000;31:1–20.
-
- Aoyama K, McSweeney FK. Habituation may contribute to within-session decreases in responding under high-rate schedules of reinforcement. Animal Learning & Behavior. 2001;29:79–91.
-
- Belke TW, Kwan TY. The effect of changes in availability on food selection at different levels of deprivation. Psychological Record. 2000;50:529–541.
Publication types
MeSH terms
Grants and funding
LinkOut - more resources
Full Text Sources