. 2006 Aug;20(8):1825-37.
doi: 10.1210/me.2006-0046. Epub 2006 Mar 30.

Bip is a molecular link between the phase I and phase II estrogenic responses in uterus

Affiliations

Bip is a molecular link between the phase I and phase II estrogenic responses in uterus

Sanhita Ray et al. Mol Endocrinol. 2006 Aug.

Abstract

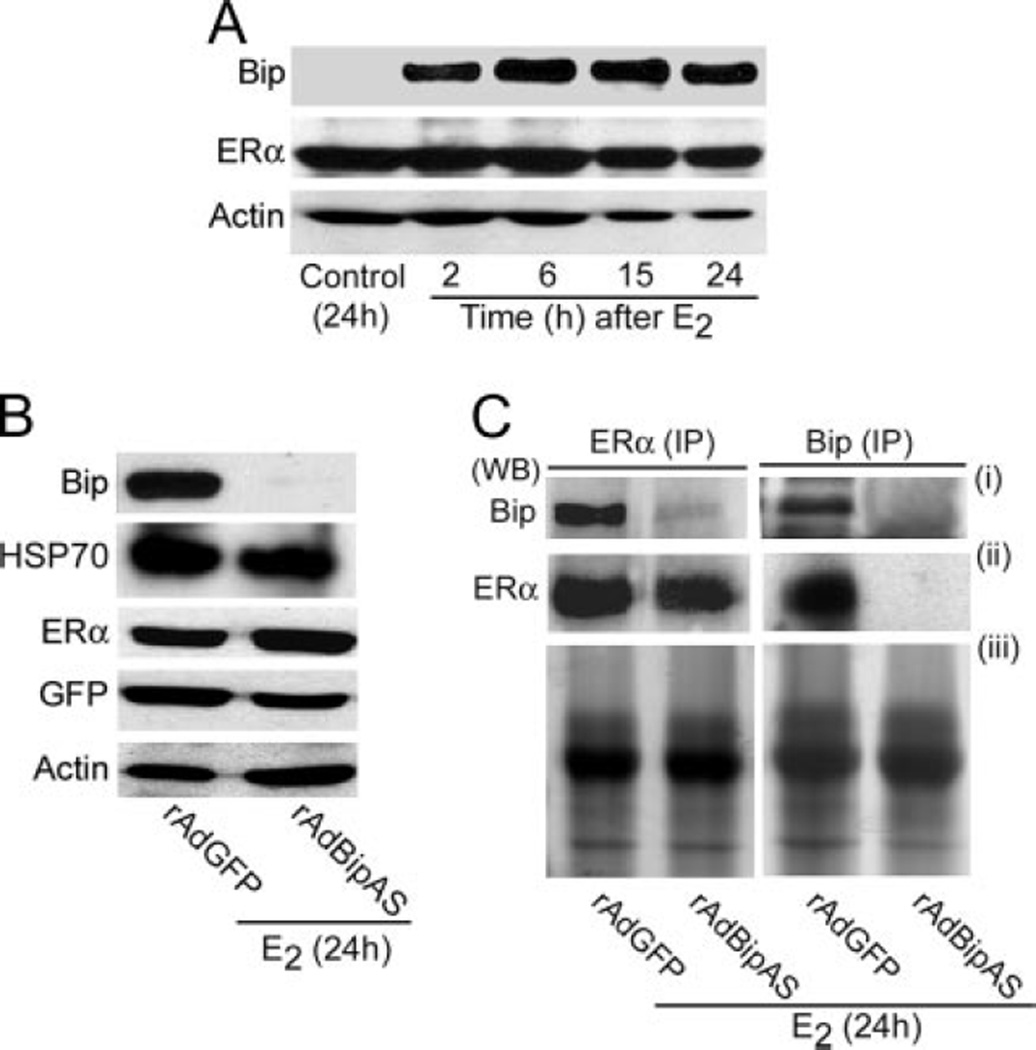
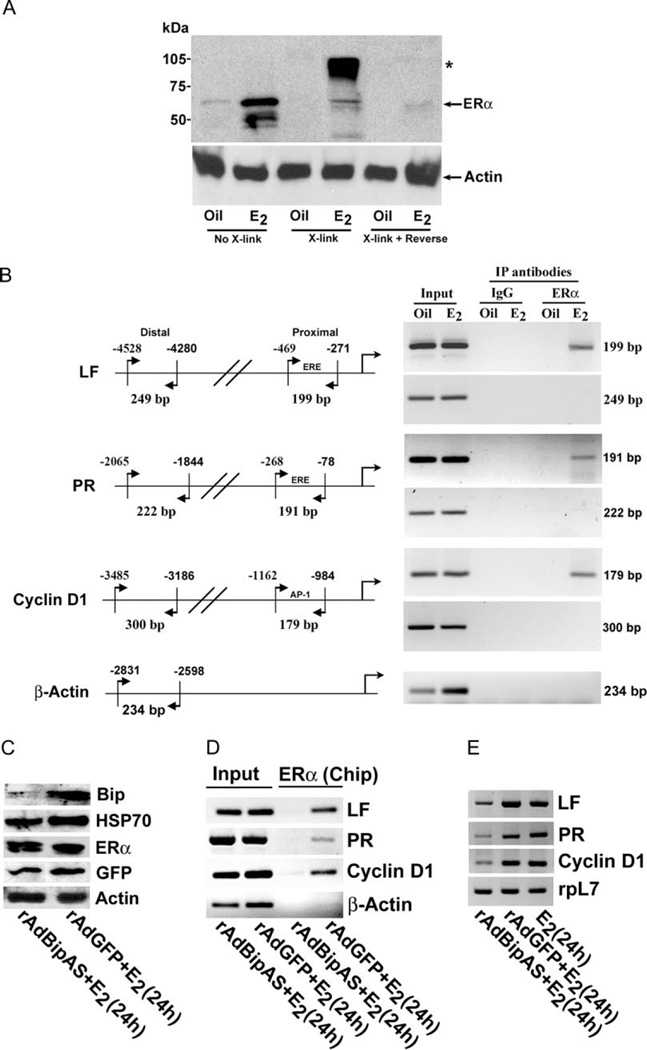
Uterine estrogenic actions are biphasic, early (phase I) and late (phase II) responses. However, the molecular linkage between these phases is not known. Although certain phase I responses are considered estrogen receptor (ER)alpha and ERbeta independent, the phase II responses are ERalpha dependent. We previously observed that among several genes Bip is induced by estrogen in the mouse uterus in an ER-independent manner as a phase I response. Bip is a member of the chaperone family and plays roles in protein processing and confers cellular protection. However, its role in estrogen-dependent uterine biology is unknown. We show here a new function of Bip in regulating estrogen signaling in the uterus. Bip, induced during the phase I responses, molecularly interacts with ERalpha required for estrogen-mediated phase II growth responses. Utilizing in vivo and in vitro model systems, we found that adenovirus-driven suppression of Bip antagonizes ERalpha-mediated uterine gene transcription. Importantly, down-regulation of Bip compromises estrogen-dependent phase II growth responses with sustained phase I responses. In conclusion, Bip is critical for coordinating estrogen-elicited biphasic responses and serves as a molecular link between ERalpha-independent and -dependent estrogenic responses in the uterus.


Figures

Fig. 1
Fig. 1. Analysis of Estrogen-Dependent Regulation of Bip and ERα Proteins in Uteri of Wild-Type Mice
Adult ovariectomized wild-type mice were given a single injection (sc) of E2 (100 ng/mouse) and killed at indicated times. A, Uterine tissue extracts were analyzed by Western blotting using the primary antibodies for Bip and actin. B and C, Uterine tissue extracts were immunoprecipitated with Bip-specific primary antibody, and then analyzed by Western blotting using Bip- (B) or ERα- (C) specific antibodies. The intense band detected at approximately 55 kDa in all lanes represents heavy chain subunit of IgG (this shown as an internal loading control). Arrow denotes the position of the detected protein band. In our control experiments, immunoprecipitation using normal goat serum did not detect any specific bands for Bip or ERα by Western blotting (data not shown). D, Uterine tissue extracts were analyzed by Western blotting using the primary antibody for ERα and actin. IP, Immunoprecipitation; WB, Western blot.
Fig. 2
Fig. 2. Estrogen-Dependent Regulation of Bip and ERα in Vitro
A, Primary culture of uterine stromal cells (at 70–80% confluence) were treated with E2 (10 nm) or ethyl alcohol (0.002% final concentration) (as vehicle control) at indicated times and then analyzed by Western blotting for expression of Bip, ERα, and actin. B, Primary cultured cells (at 70–80% confluence) were subjected to infection (~10 pfu/cell) with adenoviruses rAdBipAS or rAdGFP (empty control) for 12 h followed by initiation of E2 (10 nm) treatment for 24 h. Cellular extracts were analyzed by Western blotting for expression of Bip, HSP70, ERα, GFP, and actin. C, Experimental conditions were same as described in panel B. Cell extracts were analyzed after immunoprecipitation using primary antibodies against ERα and Bip followed by Western blotting for Bip (i) and ERα (ii). Coomassie stain gel pictures are shown as loading controls (iii). WB, Western blot; IP, immunoprecipitation.
Fig. 3
Fig. 3. Analysis of Estrogen-Dependent Effects after Perturbation of Bip Expression in the Primary Culture of Uterine Stromal Cells
A, Determination of endogenous ERα-mediated transactivation of luciferase activity. Cell extracts were analyzed by luciferase activity as described in Materials and Methods. Data (as percent) are represented by mean ± sem of relative luciferase activity from four independent experiments. Data were analyzed using Student’s paired t test (P < 0.01). B, Analysis of cellular growth. Primary cultured cells were subjected to infection with 1 pfu/cell of adenoviruses (rAdBipAs or rAdGFP) for 12 h, followed by the treatment of E2 (10 nm) for indicated times. Noninfected cells were also analyzed in parallel with or without addition of estrogen. Cellular proliferation was assayed as described in Materials and Methods. The asterisks (**) indicate statistically different (P < 0.01; ANOVA followed by Newman-Keul’s multiple-range test) as compared with corresponding control group on particular days. C, Analysis of cellular viability. Cells on d 3 as examined in panel B were visualized by fluorescence microscopy after staining with 4’,6-diamidino-2-phenylindole (DAPI) and propidium iodide (PI). Viable cells exclude PI, whereas dead cells stain with PI (red) and DAPI (blue).
Fig. 4
Fig. 4. Analysis of Estrogen-Dependent Effects after Perturbation of Bip Expression in the Uterus
A, Analysis of estrogen-induced ERα fixation to high molecular complex by Western blotting. Uterine tissues were subjected to cross-linking using 1% formaldehyde (X-link), followed by reversal of cross-linking using heat treatment (X-link + reverse). Tissue extracts at different steps of this procedure were analyzed by Western blotting using ERα-specific antibody. Arrow indicates the position of uncomplexed ERα band, whereas the asterisk (*) denotes the position of macromolecular association of ERα. Results show that ERα-associated high molecular complex with retarded migration in SDS-PAGE gel can be reversed by prolonged heat treatment. B, Analysis of estrogen-induced recruitment of ERα to the promoter of LF, PR, and cyclin D1 genes. Chip analysis was performed using ERα antibody or normal serum IgG (as control) as described in Materials and Methods. The presence of the promoter DNA before immunoprecipitation was confirmed by PCR (Input). For PCR amplification technique, the cycle parameters were the same as described elsewhere(7). C, Analysis of adenovirus-mediated expression in the uterus. Uterine tissues were collected after administration of adenoviruses rAdBipAs or rAdGFP (control) in mice as described in Materials and Methods, followed by injections of E2 (100 ng/mouse) for 24 h. Western blot analysis for the expression of Bip, Hsp70, ERα, GFP, and actin. D, Chip analysis for estrogen-induced recruitment of ERα to LF, PR, cyclin D1, and β-actin gene promoters. E, RT-PCR analysis of expression for LF, PR, cyclin D1, and ribosomal protein-L7 (rpL7) genes. rpL7 was used as a constitutive gene. IP, Immunoprecipitation.
Fig. 5
Fig. 5. Analysis of Estrogen-Dependent Water Permeability Responses in Ovariectomized Mice after Administration of Adenoviruses
Experimental conditions were same as described in Fig. 4C. A, Analysis of uterine wet weights. Uterine weights were examined at 6 and 24 h after E2 injection. Values with asterisks are statistically different (P< 0.01; ANOVA followed by Newman-Keul’s multiple-range test) as compared with their corresponding control groups. B, Analysis of uterine water uptake. The asterisk indicates statistically different (P < 0.01; ANOVA followed by Newman-Keul’s multiple-range test) as compared with control group. C, Analysis of uterine macromolecular uptake. The fluorescence for the uptake of rhodamine-BSA in uterine tissue sections was visualized by direct fluorescence (panels b and d) and phase-contrast (panels a and c) microscope. le, Luminal epithelium; s, stroma. Bars, 100 µm. D, Analysis of uterine permeability gene expression. Frozen uterine sections were analyzed by in situ hybridization of VEGF and Flk-1. le, Luminal epithelium; myo, myometrium; s, stroma. Bars, 100 µm. VEGF, Vascular endothelial growth factor; Flk-1, VEGF receptor 2.
Fig. 6
Fig. 6. Analysis of Estrogen-Dependent Regulation of Uterine Cell Growth in Ovariectomized Mice after Administration of Adenoviruses
Uterine tissues were collected from mice after administration of adenoviruses and E2 as described in Fig. 5. A, BrdU immunostaining. Reddish-brown nuclear deposits indicate the sites of positive immunostaining. le, Luminal epithelium; ge, glandular epithelium; s, stroma. Bars, 50 µm. Dramatic induction of uterine edema within stromal compartment (shown by arrow) is clearly visible in rAdBipAS+E2 group. B, Quantitation of BrdU-positive cells in separate uterine compartments as shown in panel A. Approximately 500 cells were counted in each uterine compartment. The data presented here after the analysis of at least 10 different mice from each group. Values with asterisks are statistically different (P < 0.01; ANOVA followed by Newman-Keul’s multiple-range test) as compared with their corresponding control groups. C, TUNEL staining. Uterine cross-sections were incubated with TUNEL reaction mixture as described by Yue et al. (45). After a brief rinse in PBS, sections were incubated in streptavidin-HRP solution, followed by incubation in diaminobenzidine solution for color development. Sections were viewed after light hematoxylin counterstaining. Apoptotic cells are detected by dark brown staining (arrows). A representative oil-treated section is provided as control. le, Luminal epithelium; ge, glandular epithelium; s, stroma. Bars, 50 µm. D, Quantitation of TUNEL-positive cells in different uterine compartments as shown in panel C. Approximately 500 cells were counted in each uterine compartment. The data are presented here after the analysis of at least 10 different mice from each group. Values with asterisks are statistically different (P< 0.01; ANOVA followed by Newman-Keul’s multiple-range test) as compared with their corresponding control groups.

Similar articles

Cited by

References

    1. Couse JF, Korach KS. Estrogen receptor null mice: what have we learned and where will they lead us? Endocr Rev. 1999;20:358–417. - PubMed
    1. Tsai MJ, O’Malley BW. Molecular mechanisms of action of steroid/thyroid receptor superfamily members. Annu Rev Biochem. 1994;63:451–486. - PubMed
    1. Dey SK, Lim H, Das SK, Reese J, Paria BC, Daikoku T, Wang H. Molecular cues to implantation. Endocr Rev. 2004;25:341–373. - PubMed
    1. Das SK, Tan J, Raja S, Halder J, Paria BC, Dey SK. Estrogen targets genes involved in protein processing, calcium homeostasis and Wnt signaling in the mouse uterus independent of estrogen receptor-α and -β. J Biol Chem. 2000;275:28834–28842. - PubMed
    1. Hewitt SC, Deroo BJ, Hansen K, Collins J, Grissom S, Afshari CA, Korach KS. Estrogen receptor-dependent genomic responses in the uterus mirror the biphasic physiological response to estrogen. Mol Endocrinol. 2003;17:2070–2083. - PubMed

Publication types

MeSH terms