. 2006 Apr 11;103(15):5781-6.
doi: 10.1073/pnas.0600745103. Epub 2006 Mar 30.

A noncoding RNA is a potential marker of cell fate during mammary gland development

Affiliations

A noncoding RNA is a potential marker of cell fate during mammary gland development

Melanie R Ginger et al. Proc Natl Acad Sci U S A. .

Abstract

PINC is a large, alternatively spliced, developmentally regulated, noncoding RNA expressed in the regressed terminal ductal lobular unit-like structures of the parous mammary gland. Previous studies have shown that this population of cells possesses not only progenitor-like qualities (the ability to proliferate and repopulate a mammary gland) and the ability to survive developmentally programmed cell death but also the inhibition of carcinogen-induced proliferation. Here we report that PINC expression is temporally and spatially regulated in response to developmental stimuli in vivo and that PINC RNA is localized to distinct foci in either the nucleus or the cytoplasm in a cell-cycle-specific manner. Loss-of-function experiments suggest that PINC performs dual roles in cell survival and regulation of cell-cycle progression, suggesting that PINC may contribute to the developmentally mediated changes previously observed in the terminal ductal lobular unit-like structures of the parous gland. This is one of the first reports describing the functional properties of a large, developmentally regulated, mammalian, noncoding RNA.


Conflict of interest statement

Conflict of interest statement: No conflicts declared.

Figures
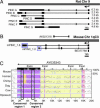
Fig. 1.
Fig. 1.
Overview of the PINC genomic region. (A) Diagrammatic representation of the rat PINC transcriptional locus showing the major 6.3-kb full-length transcript PINC A (GenBank accession no. AY035343) and alternate transcripts B (GenBank accession no. DQ099683), C (GenBank accession no. DQ099682), D (GenBank accession no. DQ105700), E (GenBank accession no. DQ080210), F (GenBank accession no. DQ105701), and G (GenBank accession no. DQ080211). Sizes of the transcripts are indicated. Transcripts initiate from the minus (−) strand and are presented relative to the plus (+) strand of the rat genome. (B) Diagrammatic representation of the mouse PINC transcriptional locus showing the two transcripts (mPINC_1.6 and mPINC_1.0) identified from the mouse EST database. These transcripts contain unique 3′-terminal exons indicated by two boxed regions. The position of an additional EST clone (GenBank accession no. BE377788) is also indicated. All three transcripts initiate from the minus (−) strand and are presented relative to the plus (+) strand. The position of an independent overlapping transcriptional unit identified as RIKEN clone D530049I02 (GenBank accession no. AK021318) is indicated. AK021318 is transcribed from the plus (+) strand. (C) Graphical output from a multipipmaker alignment of the PINC region and flanking sequences from mouse (assembly May 2004), rat (assembly June 2003), human (assembly May 2004), chimpanzee, dog (assembly July 2004), cow, and opossum genomes using the rat genomic sequence as reference sequence. The transcriptional orientation and position of exons of the main rat transcript (GenBank accession no. AY035343) are indicated above the plot. Genomic features indicated by the colored underlay include conserved exons (light purple), introns (light yellow), alternative exons expressed in the mouse (light blue), and putative proximal promoter (light pink). The exon of an independent, overlapping gene (GenBank accession no. AK024261) is indicated by light orange.
Fig. 2.
Fig. 2.
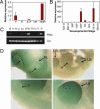
Developmental and tissue-specific expression of PINC. (A) PINC expression in response to the different hormonal regimens described in Methods. PINC RNA levels were analyzed by real-time PCR by using primers designed to amplify all seven isoforms of rat PINC and are presented as relative expression when normalized to levels of cytokeratin 8 (a marker of mammary epithelial cells). PINC expression in 18-day-pregnant mammary glands is presented as a positive control (note the use of different scale bars). (B) PINC expression at different stages of mammary development in 42-day-old virgin rats (42d vir), 96-day-old virgin rats (96d vir), 5-, 12-, and 18-days-pregnant rats (5dP, 12dP, and 18dP), 2- and 10-days-lactating rats (2dL and 10dL), and rats after 5 and 28 days of involution (5d inv and 28d inv) was assessed by real-time PCR (as described above). (C) Tissue-specific expression of PINC. PINC expression was examined by RT-PCR by using RNA prepared from a range of adult tissues: brain (B), heart (H), kidney (K), liver (Li), lung (Lu), ovary (O), testes (Te), Thymus (Th), uterus (U), virgin mammary gland (V), and mid-pregnant mammary gland (P). (D) Whole-mount in situ hybridization showing PINC expression in a 10.5-day embryo by using a probe that detects both PINC_1.6 and PINC_1.0 transcripts. Expression was detected in the lens (L), heart (H), fore and hind limb buds (LB), intranasal cleft (IC), retinal layer (RL), mandibular arch (MA), and somites (S).
Fig. 3.
Fig. 3.
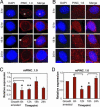
Expression and intracellular localization of PINC RNA in HC11 cells. (A and B) FISH showing the localization of mPINC_1.0 (A) and mPINC_1.6 (B) RNA at different stages of cell cycle in HC11 cells. DAPI-stained images of the same field are shown in parallel. HC11 cells were growth-arrested for 72 h to synchronize cell cycle; normal growth medium was returned, and cells were then fixed on coverslips at various time points over the next 24 h and examined by FISH. Images were obtained by using deconvolution microscopy (10–12 independent fields imaged per time point), and representative captured raw images were deconvolved to produce high-resolution images. (Scale bar: 10 μm.) (C and D) Expression of mPINC_1.0 (C) and mPINC_1.6 (D) RNA at different stages of the cell cycle. HC11 cells were growth-arrested for 72 h, and then serum and growth factors were returned. RNA was prepared from cells at various time points after cell-cycle reentry (as indicated), and RNA levels were analyzed by real-time PCR by using primers specific to either mPINC_1.0 or mPINC_1.6. Results were normalized to cyclophilin expression and plotted as relative expression. ∗, P < 0.05; ∗∗, P < 0.005.
Fig. 4.
Fig. 4.
Knocking down mPINC_1.6 alters cell-cycle progression. (A) siRNA knockdown strategy. siRNAs were designed to target sequences in the unique 3′-terminal exon of mPINC_1.0 and mPINC_1.6 (illustrated diagrammatically) to allow transcript-specific knockdown of each mPINC isoform. (B) Immunofluorescent detection of BrdU incorporation in HC11s transfected with siRNAs against mPINC_1.0 (1.0 A), mPINC_1.6 (1.6 A), or an unrelated negative control oligo and mock-transfected cells. Transfected cells were growth-arrested for 72 h, and then normal growth medium was returned for 6 hours to reinitiate cell cycle. HC11s were labeled with BrdU for 45 min before fixation, and BrdU incorporation was measured by immunofluorescence by using a FITC-conjugated antibody against BrdU. (C) BrdU incorporation was measured by immunofluorescence (as described in B) and calculated as the percentage of BrdU-positive cells relative to total DAPI-stained nuclei averaged over six independent microscope fields. Knocking down mPINC_1.6 (1.6A) resulted in a 16-fold increase in the number of BrdU-positive cells compared with cells transfected with negative control siRNA. The percentage of BrdU-positive cells transfected with siRNA against mPINC_1.0 (1.0A) was similar to that of the control cells. ∗, P < 0.002.
Fig. 5.
Fig. 5.
Knocking down mPINC_1.0 induces apoptosis in serum-free conditions. (A) The percentage of TUNEL-positive cells in HC11s transfected with siRNA against mPINC_1.0 (siRNAs 1.0A, 1.0B and 1.0C), mPINC_1.6 (1.6A), negative control siRNA, or mock-transfected siRNA was calculated relative to total number of DAPI-stained nuclei. ∗∗, P < 0.0005; ∗, P < 0.003. (B) HC11s were transfected with siRNA against mPINC_1.0 (1.0A) or a negative control oligo, maintained under normal growth conditions for 48 h after transfection, and then placed in serum-free medium for 3 h before fixation. Caspase-3 activation was examined by immunofluorescent detection of cleaved caspase-3, and the percentage of cleaved caspase-3-positive cells was calculated relative to the total number of DAPI-stained nuclei. ∗∗, P < 0.0005; ∗, P < 0.003. Similar results were obtained with three independent siRNAs against mPINC_1.0 (data not shown).

Similar articles

Cited by

References

    1. Mattick J. S. BioEssays. 2003;25:930–939. - PubMed
    1. Okazaki Y., Furuno M., Kasukawa T., Adachi J., Bono H., Kondo S., Nikaido I., Osato N., Saito R., Suzuki H., et al. Nature. 2002;420:563–573. - PubMed
    1. Kampa D., Cheng J., Kapranov P., Yamanaka M., Brubaker S., Cawley S., Drenkow J., Piccolboni A., Bekiranov S., Helt G., et al. Genome Res. 2004;14:331–342. - PMC - PubMed
    1. Rodriguez A., Griffiths-Jones S., Ashurst J. L., Bradley A. Genome Res. 2004;14:1902–1910. - PMC - PubMed
    1. Waterston R. H., Lindblad-Toh K., Birney E., Rogers J., Abril J. F., Agarwal P., Agarwala R., Ainscough R., Alexandersson M., An P., et al. Nature. 2002;420:520–562. - PubMed

Publication types

LinkOut - more resources