

DNA damage induced by hyperoxia: quantitation and correlation with lung injury
- PMID: 16574945
- PMCID: PMC2643280
- DOI: 10.1165/rcmb.2005-0340OC
DNA damage induced by hyperoxia: quantitation and correlation with lung injury
Abstract
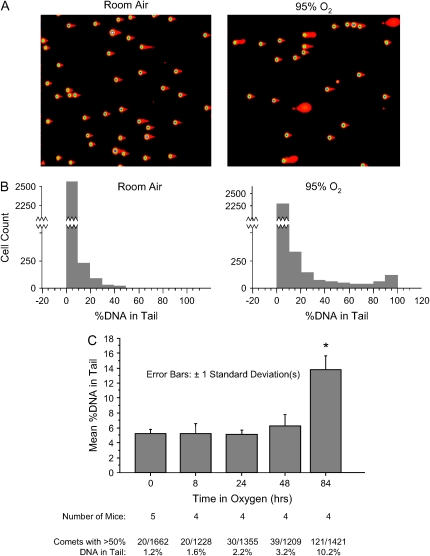
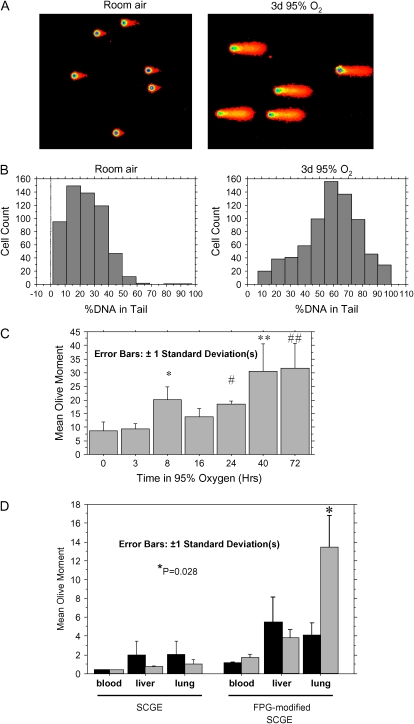
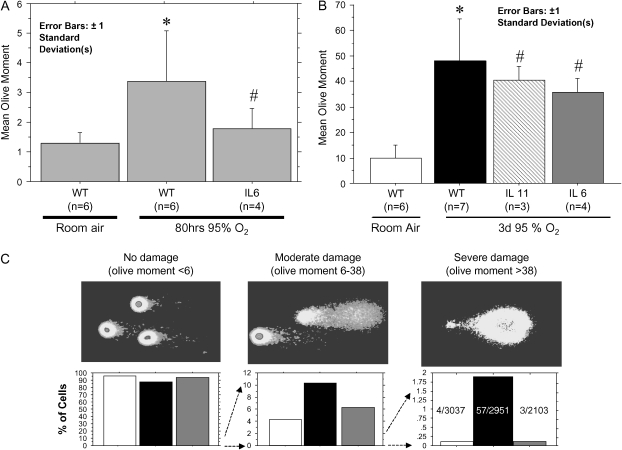
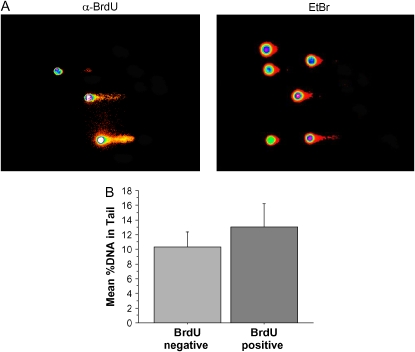
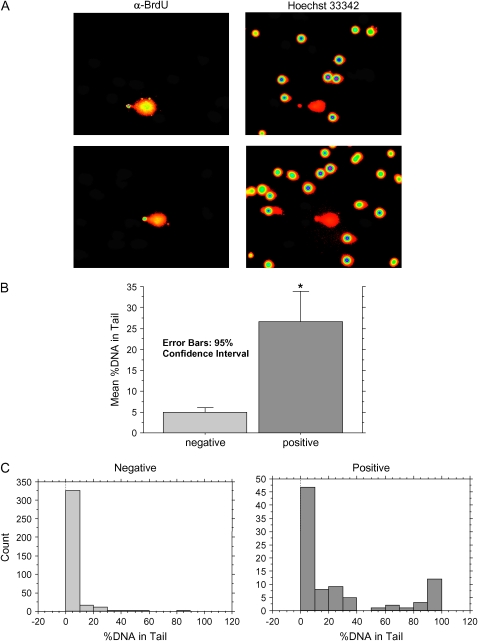
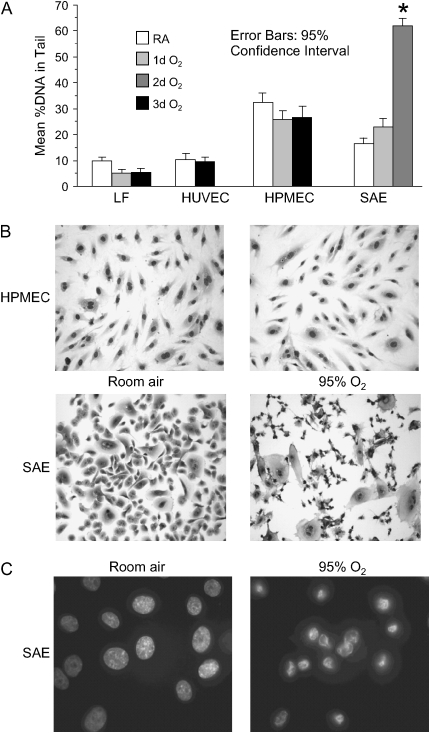
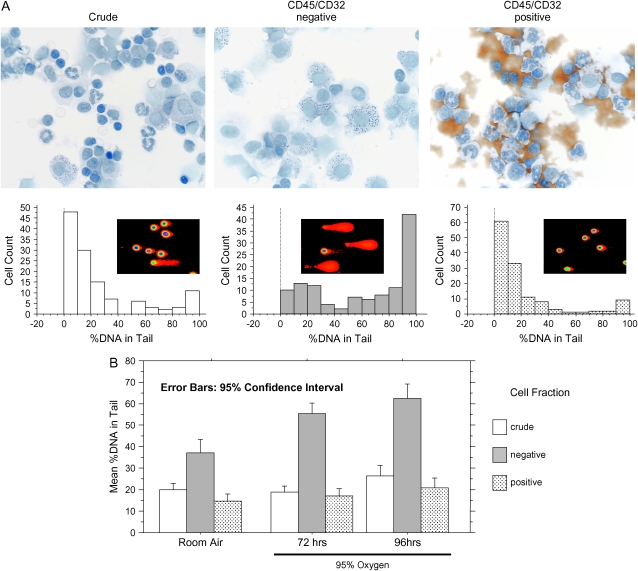
Inspired oxygen, an essential therapy for cardiorespiratory disorders, has the potential to generate reactive oxygen species that damage cellular DNA. Although DNA damage is implicated in diverse pulmonary disorders, including neoplasia and acute lung injury, the type and magnitude of DNA lesion caused by oxygen in vivo is unclear. We used single-cell gel electrophoresis (SCGE) to quantitate two distinct forms of DNA damage, base adduction and disruption of the phosphodiester backbone, in the lungs of mice. Both lesions were induced by oxygen, but a marked difference between the two was found. With 40 h of oxygen exposure, oxidized base adducts increased 3- to 4-fold in the entire population of lung cells. This lesion displayed temporal characteristics (a progressive increase over the first 24 h) consistent with a direct effect of reactive oxygen species attack upon DNA. DNA strand breaks, on the other hand, occurred in < 10% of pulmonary cells, which acquired severe levels of the lesion; dividing cells were preferentially affected. Characteristics of these cells suggested that DNA strand breakage was secondary to cell death, rather than a primary effect of reactive oxygen species attack on DNA. By analysis of IL-6- and IL-11-overexpressing transgenic animals, which are resistant to hyperoxia, we found that DNA strand breaks, but not base damage, correlated with acute lung injury. Analysis of purified alveolar type 2 preparations from hyperoxic mice indicated that strand breaks preferentially affected this cell type.
Figures
Similar articles
-
Targeted lung expression of interleukin-11 enhances murine tolerance of 100% oxygen and diminishes hyperoxia-induced DNA fragmentation.J Clin Invest. 1998 May 1;101(9):1970-82. doi: 10.1172/JCI1337. J Clin Invest. 1998. PMID: 9576762 Free PMC article.
-
Interleukin-6-induced protection in hyperoxic acute lung injury.Am J Respir Cell Mol Biol. 2000 May;22(5):535-42. doi: 10.1165/ajrcmb.22.5.3808. Am J Respir Cell Mol Biol. 2000. PMID: 10783124
-
Transgenic overexpression of granulocyte macrophage-colony stimulating factor in the lung prevents hyperoxic lung injury.Am J Pathol. 2003 Dec;163(6):2397-406. doi: 10.1016/S0002-9440(10)63594-8. Am J Pathol. 2003. PMID: 14633611 Free PMC article.
-
Hyperoxia-induced cell death in the lung--the correlation of apoptosis, necrosis, and inflammation.Ann N Y Acad Sci. 1999;887:171-80. doi: 10.1111/j.1749-6632.1999.tb07931.x. Ann N Y Acad Sci. 1999. PMID: 10668473 Review.
-
Alveolar cell death in hyperoxia-induced lung injury.Ann N Y Acad Sci. 2003 Dec;1010:405-16. doi: 10.1196/annals.1299.074. Ann N Y Acad Sci. 2003. PMID: 15033761 Review.
Cited by
-
Antimicrobial peptides increase tolerance to oxidant stress in Drosophila melanogaster.J Biol Chem. 2011 Feb 25;286(8):6211-8. doi: 10.1074/jbc.M110.181206. Epub 2010 Dec 9. J Biol Chem. 2011. PMID: 21148307 Free PMC article.
-
Deletion of P2X7 attenuates hyperoxia-induced acute lung injury via inflammasome suppression.Am J Physiol Lung Cell Mol Physiol. 2016 Mar 15;310(6):L572-81. doi: 10.1152/ajplung.00417.2015. Epub 2016 Jan 8. Am J Physiol Lung Cell Mol Physiol. 2016. PMID: 26747786 Free PMC article.
-
Electrophilic Aldehyde 4-Hydroxy-2-Nonenal Mediated Signaling and Mitochondrial Dysfunction.Biomolecules. 2022 Oct 25;12(11):1555. doi: 10.3390/biom12111555. Biomolecules. 2022. PMID: 36358905 Free PMC article. Review.
-
Thioredoxin-deficient mice, a novel phenotype sensitive to ambient air and hypersensitive to hyperoxia-induced lung injury.Am J Physiol Lung Cell Mol Physiol. 2015 Mar 1;308(5):L429-42. doi: 10.1152/ajplung.00285.2014. Epub 2014 Dec 24. Am J Physiol Lung Cell Mol Physiol. 2015. PMID: 25539854 Free PMC article.
-
DNA Repair Interacts with Autophagy To Regulate Inflammatory Responses to Pulmonary Hyperoxia.J Immunol. 2017 Apr 1;198(7):2844-2853. doi: 10.4049/jimmunol.1601001. Epub 2017 Feb 15. J Immunol. 2017. PMID: 28202616 Free PMC article.
References
-
- Smith LJ. Hyperoxic lung injury: biochemical, cellular, and morphologic characterization in the mouse. J Lab Clin Med 1985;106:269–278. - PubMed
-
- Chandel NS, Schumacker PT. Cellular oxygen sensing by mitochondria: old questions, new insight. J Appl Physiol 2000;88:1880–1889. - PubMed
-
- Cochrane CG. Cellular injury by oxidants. Am J Med 1991;91:23S–30S. - PubMed
-
- Halliwell B, Aruoma OI. DNA damage by oxygen-derived species: its mechanism and measurement in mammalian systems. FEBS Lett 1991; 281:9–19. - PubMed
-
- Zhou BB, Elledge SJ. The DNA damage response: putting checkpoints in perspective. Nature 2000;408:433–439. - PubMed
Publication types
MeSH terms
Substances
Grants and funding
LinkOut - more resources
Full Text Sources
Medical
