. 2006 Apr 1;78(7):2199-208.
doi: 10.1021/ac0517085.

Assessment of analytical reproducibility of 1H NMR spectroscopy based metabonomics for large-scale epidemiological research: the INTERMAP Study

Affiliations

Assessment of analytical reproducibility of 1H NMR spectroscopy based metabonomics for large-scale epidemiological research: the INTERMAP Study

Marc-Emmanuel Dumas et al. Anal Chem. .

Abstract

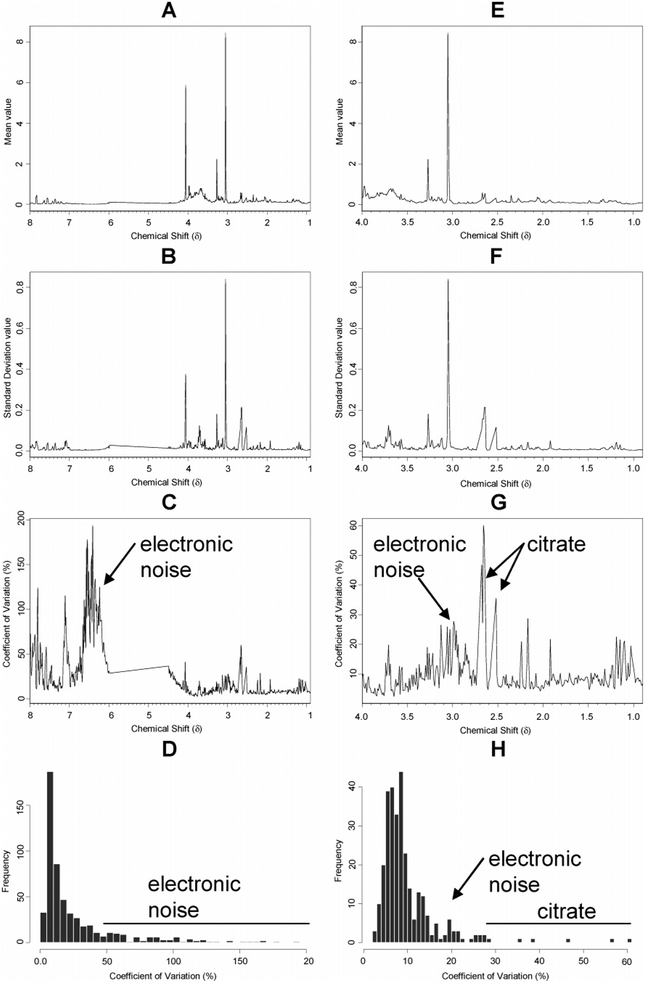
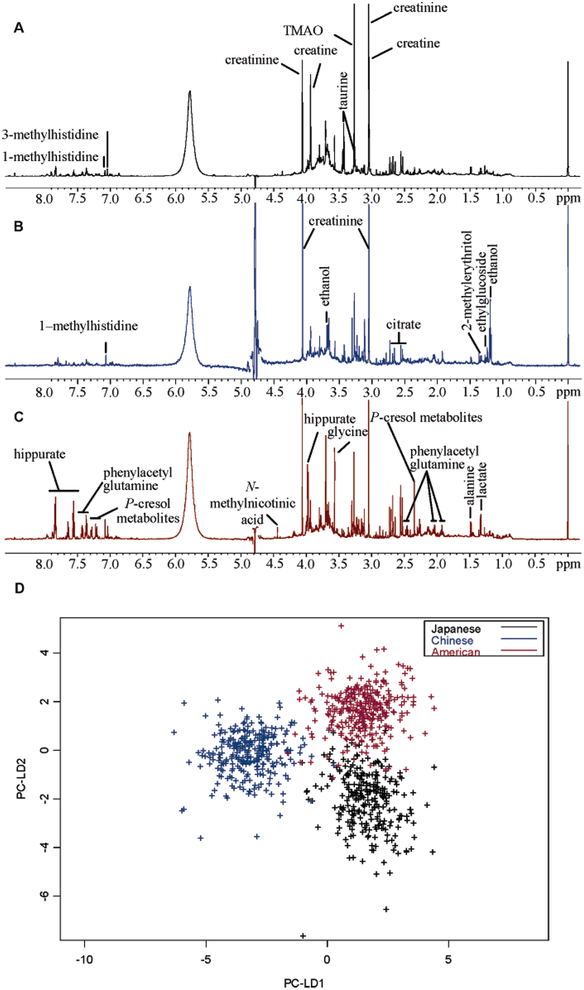
Large-scale population phenotyping for molecular epidemiological studies is subject to all the usual criteria of analytical chemistry. As part of a major phenotyping investigation we have used high-resolution 1H NMR spectroscopy to characterize 24-h urine specimens obtained from population samples in Aito Town, Japan (n = 259), Chicago, IL (n = 315), and Guangxi, China (n = 278). We have investigated analytical reproducibility, urine specimen storage procedures, interinstrument variability, and split specimen detection. Our data show that the multivariate analytical reproducibility of the NMR screening platform was >98% and that most classification errors were due to urine specimen handling inhomogeneity. Differences in metabolite profiles were then assessed for Aito Town, Chicago, and Guangxi population samples; novel combinations of biomarkers were detected that separated the population samples. These cross-population differences in urinary metabolites could be related to genetic, dietary, and gut microbial factors.


Figures

Figure 1.
Figure 1.
Summary of INTERMAP study design serving as basis for 1H NMR metabonomic urinalysis protocol. Collection of 24-h urine specimens during visits 2 and 4, respectively, 1 day after visit 1 and 3. 8.3% of the specimens split at source and given different identification labels. All the specimens were analyzed by 1H NMR.
Figure 2.
Figure 2.
Position and dispersion parameters and coefficients of variation for the quality control urine specimens. (A) Mean spectrum in the δ1.0−8.00 range, (B) standard deviation spectrum in the δ1.0−δ8.00 range, (C) coefficient of variation spectrum in the δ1.0−δ8.00 range, (D) distribution of the coefficients of variation in the δ1.0−δ8.00 range, (E) mean spectrum in the δ1−δ4 range, (F) standard deviation spectrum in the δ1−δ4 range, (G) coefficient of variation spectrum in the δ1−δ4 range, and (H) distribution of the coefficients of variation in the δ1−δ4 range.
Figure 3.
Figure 3.
Identification of split urine specimens by hierarchical clustering trees of 600-MHz 1H NMR spectra. (A) Single linkage dendrogram for the American female 40–49 year group for the total spectrum, (B) NMR spectra of the two replicate specimens marked with * in (B) and their difference. The vertical axis in the dendrogram corresponds to the aggregation value computed, as described in the Experimental Section, summarizing the measure of dissimilarity (≥0) between clusters or initial samples. To identify the split urine specimens, a fixed length has been assigned to the “leaves” (i.e., individual specimens) of the clustering tree. Specimens that are very similar (i.e., splits) aggregate close to 0 (i.e., low dissimilarity).
Figure 4.
Figure 4.
600-MHz 1H NMR spectra of human urine from (A) a Japanese, (B) a Chinese, and (C) an American man. Principal assignments are marked. Key: TMAO–trimethylamine-N-oxide (the inset spectra are shown to give an indication of the spectral complexity); D) Pattern recognition of geographical origin using PC-LDA (n) 852). This model was computed with 0.01 ppm buckets in the δ0.16–9.76 range using 29 principal components for pre-compression before LDA.

References

    1. Nicholson JK; Lindon JC; Holmes E Xenobiotica 1999, 29, 1181–1189. - PubMed
    1. Nicholson JK; Connelly J; Lindon JC; Holmes E Nat. Rev. Drug Discovery 2002, 1, 153–161. - PubMed
    1. Nicholson JK; Wilson ID Nat. Rev. Drug Discovery 2003, 2, 668–676. - PubMed
    1. Griffin JL; Williams HJ; Sang E; Clarke K; Rae C; Nicholson JK Anal. Biochem 2001, 293, 16–21. - PubMed
    1. Holmes E; Caddick S; Lindon JC; Wilson ID; Kryvawych S; Nicholson JK Biochem. Pharmacol 1995, 49, 1349–1359. - PubMed

Publication types