

The exposure-response curve for ozone and risk of mortality and the adequacy of current ozone regulations
- PMID: 16581541
- PMCID: PMC1440776
- DOI: 10.1289/ehp.8816
The exposure-response curve for ozone and risk of mortality and the adequacy of current ozone regulations
Abstract
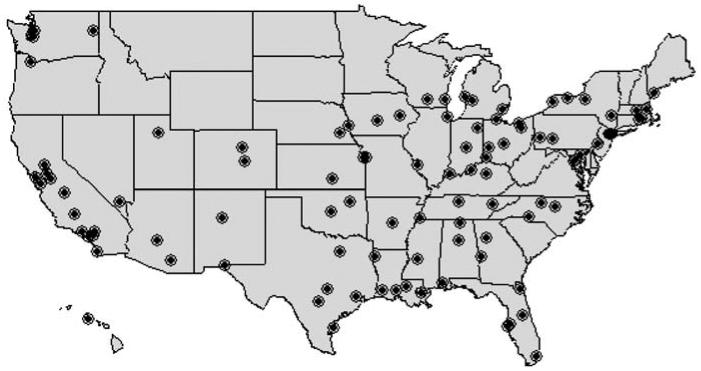
Time-series analyses have shown that ozone is associated with increased risk of premature mortality, but little is known about how O3 affects health at low concentrations. A critical scientific and policy question is whether a threshold level exists below which O3 does not adversely affect mortality. We developed and applied several statistical models to data on air pollution, weather, and mortality for 98 U.S. urban communities for the period 1987-2000 to estimate the exposure-response curve for tropospheric O3 and risk of mortality and to evaluate whether a "safe" threshold level exists. Methods included a linear approach and subset, threshold, and spline models. All results indicate that any threshold would exist at very low concentrations, far below current U.S. and international regulations and nearing background levels. For example, under a scenario in which the U.S. Environmental Protection Agency's 8-hr regulation is met every day in each community, there was still a 0.30% increase in mortality per 10-ppb increase in the average of the same and previous days' O3 levels (95% posterior interval, 0.15-0.45%). Our findings indicate that even low levels of tropospheric O3 are associated with increased risk of premature mortality. Interventions to further reduce O3 pollution would benefit public health, even in regions that meet current regulatory standards and guidelines.
Figures
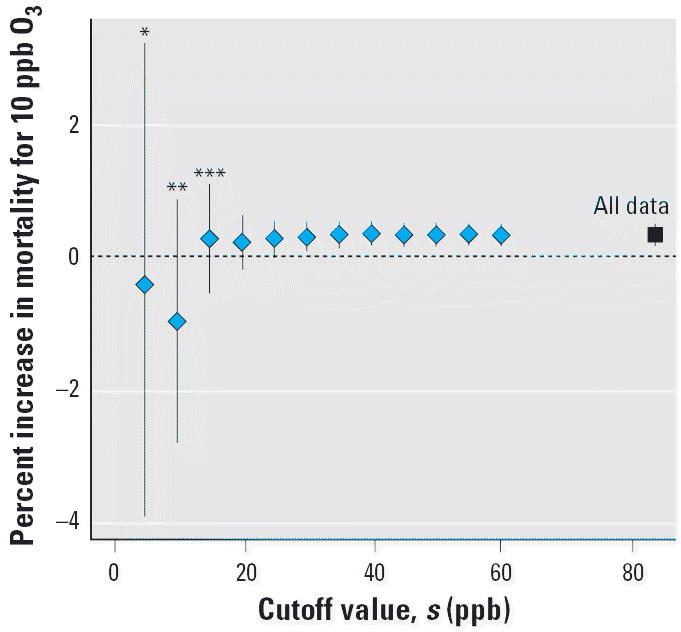
 O3 obtained by using the subset approach. Diamonds denote the point estimates, and vertical lines represent the 95% posterior intervals. Each estimate is obtained by including in the analysis only days with 24-hr average lag
O3 levels below the s value specified on the x-axis. Not all communities had sufficient data for analysis at all s values: *25 communities; **74 communities; ***92 communities. All other estimates used 98 communities. The estimate at the far right marked by a square uses all data.
O3 obtained by using the subset approach. Diamonds denote the point estimates, and vertical lines represent the 95% posterior intervals. Each estimate is obtained by including in the analysis only days with 24-hr average lag
O3 levels below the s value specified on the x-axis. Not all communities had sufficient data for analysis at all s values: *25 communities; **74 communities; ***92 communities. All other estimates used 98 communities. The estimate at the far right marked by a square uses all data.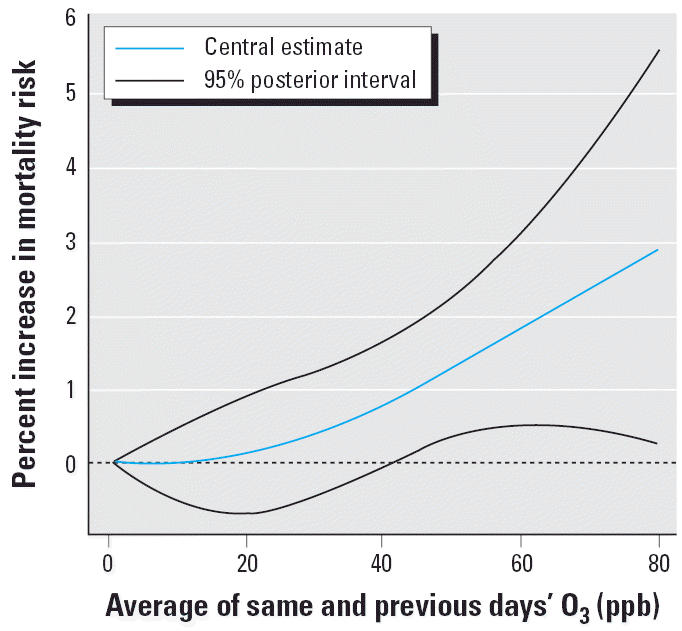
References
-
- Akaike H. 1973. Information theory and extension of the maximum likelihood principle. In: International Symposium on Information Theory (Petrov BN, Caski F, eds). Budapest: Akademiai Kaiado, 267–281.
-
- American Thoracic Society. What constitutes an adverse health effect of air pollution? Am J Respir Crit Care Med. 2000;161:665–673. - PubMed
-
- Anderson HR, Atkinson RW, Peacock JL, Marston L, Konstantinou K. 2004. Meta-Analysis of Time-Series Studies and Panel Studies of Particulate Matter (PM) and Ozone (O3). Report of a WHO Task Group. Copenhagen:World Health Organization.
Publication types
MeSH terms
Substances
Grants and funding
LinkOut - more resources
Full Text Sources
Other Literature Sources
Medical
Miscellaneous