Comparative Study
. 2006 Apr;26(8):2887-900.
doi: 10.1128/MCB.26.8.2887-2900.2006.

Keap1 recruits Neh2 through binding to ETGE and DLG motifs: characterization of the two-site molecular recognition model

Affiliations
Comparative Study

Keap1 recruits Neh2 through binding to ETGE and DLG motifs: characterization of the two-site molecular recognition model

Kit I Tong et al. Mol Cell Biol. 2006 Apr.

Abstract

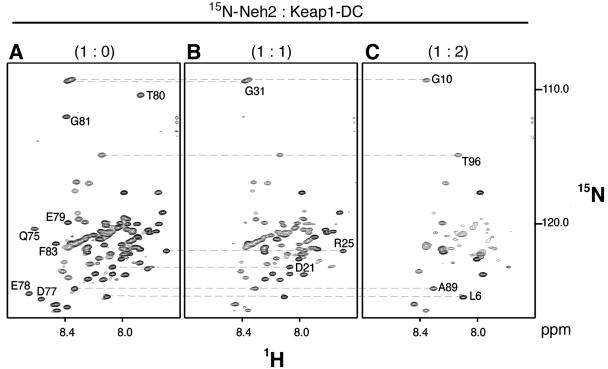
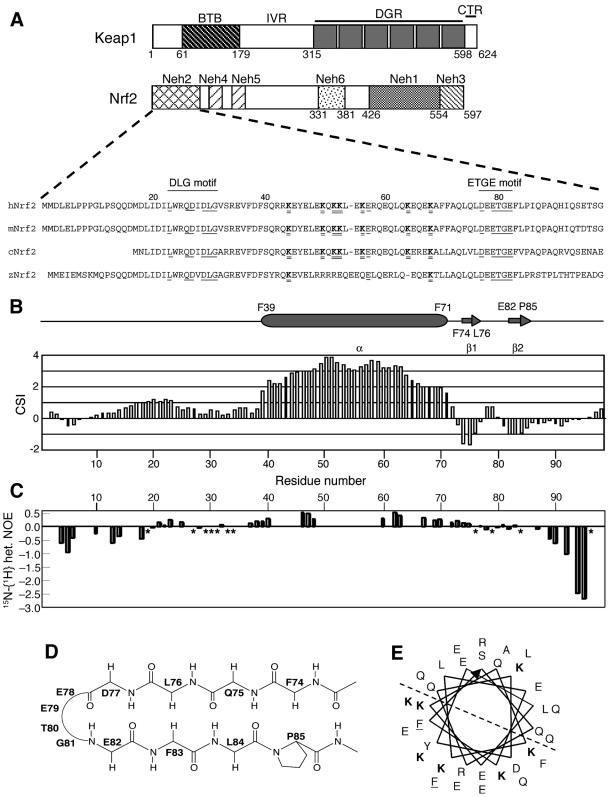
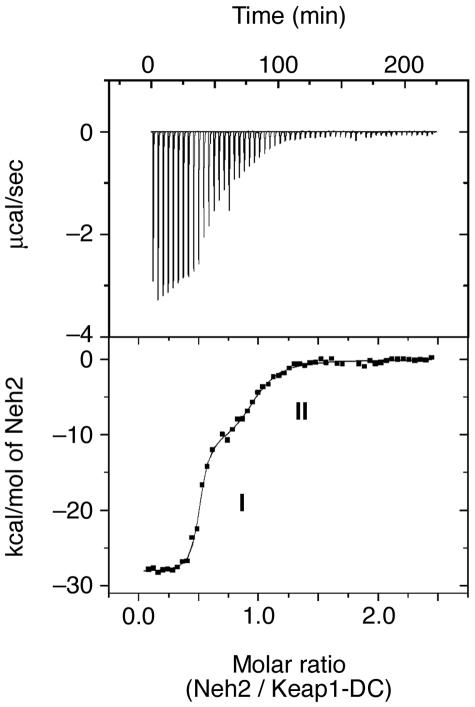
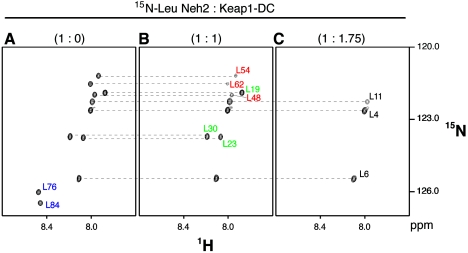
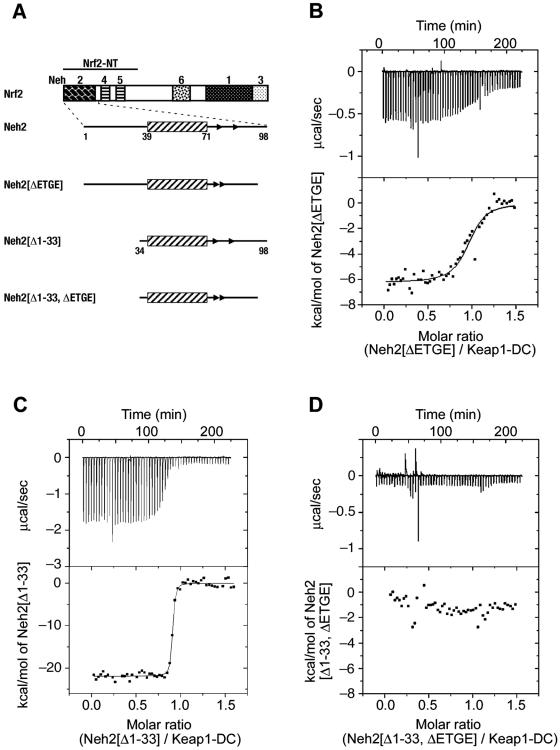
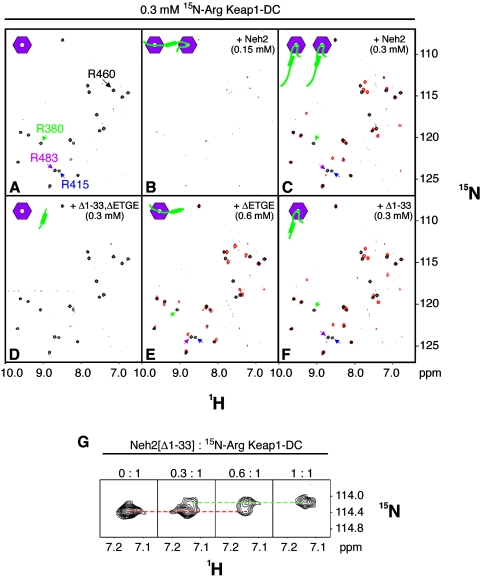
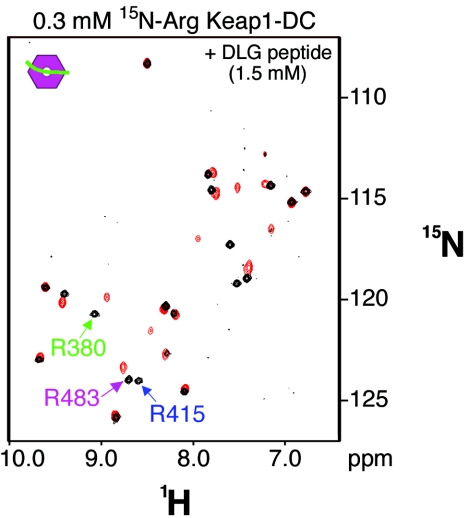
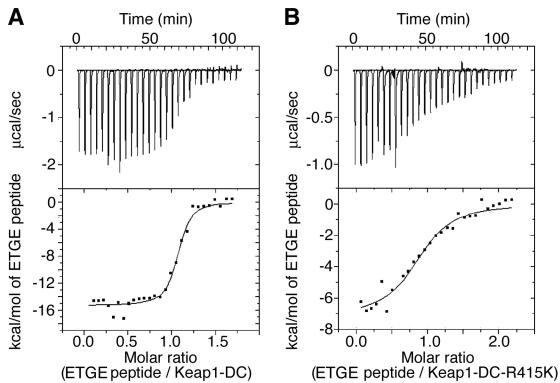
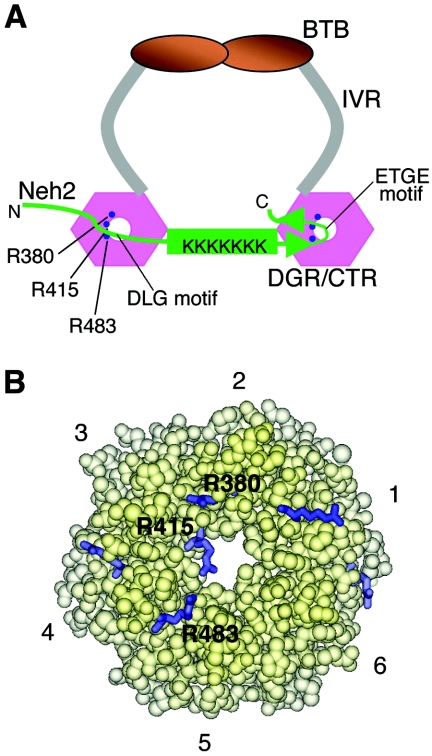
The expression of the phase 2 detoxification enzymes and antioxidant proteins is induced at the transcriptional level by Nrf2 and negatively regulated at the posttranslational level by Keap1 through protein-protein interactions with and subsequent proteolysis of Nrf2. We found that the Neh2 domain of Nrf2 is an intrinsically disordered but biologically active regulatory domain containing a 33-residue central alpha-helix followed by a mini antiparallel beta-sheet. Isothermal calorimetry analysis indicated that one Neh2 molecule interacts with two molecules of Keap1 via two binding sites, the stronger binding ETGE motif and the weaker binding DLG motif. Nuclear magnetic resonance titration study showed that these two motifs of the Neh2 domain bind to an overlapping site on the bottom surface of the beta-propeller structure of Keap1. In contrast, the central alpha-helix of the Neh2 domain does not have any observable affinity to Keap1, suggesting that this region may serve as a bridge connecting the two motifs for the association with the two beta-propeller structures of a dimer of Keap1. Based on these observations, we propose that Keap1 recruits Nrf2 by the ETGE motif and that the DLG motif of the Neh2 domain locks its lysine-rich central alpha-helix in a correct position to benefit ubiquitin signaling.


Figures

FIG. 1.
FIG. 1.
Neh2 is an intrinsically disordered but biologically active domain. 1H, 15N-TROSY-HSQC spectra of uniformly 15N-labeled Neh2 (A) and its complex with a one (B) or two (C) molar ratio of unlabeled Keap1-DC. Some of the isolated resonance signals representing residues in the β-sheet (Gln-75, Asp-77, Glu-78, Glu-79, Thr-80, Gly-81, and Phe-83) (A), residues close to the DLG motif (Asp-21, Arg-25 and Gly-31) (B), and residues at both flexible terminal ends of Neh2 (Leu-6, Gly-10, Ala-89, and Thr-96) (C) are labeled with a 1-letter amino acid code and a residue number. The relatively poor dispersion of amide proton (1H) chemical shifts indicates that Neh2 is disordered in solution (A). The disappearance of resonance signals upon the addition of Keap1-DC suggests the formation of a Neh2-Keap1 complex (B and C). The lost resonance is due to either an increase in molecular size through complex formation or an intermediate chemical exchange between free and bound conformations of Neh2.
FIG. 2.
FIG. 2.
The secondary structure and low backbone rigidity exhibited in the Neh2 domain. (A) Schematic diagram showing the protein architecture of Keap1 and Nrf2 and sequence alignment of the Neh2 domain from different species (h, human; m, mouse; c, chicken; z, zebra fish). Numbers corresponding to the residues of mouse Nrf2 are shown above the sequences. Amino acids that are conserved within a subgroup of the CNC protein family, including Nrf2, are underlined in the sequences, and regions containing the DLG and ETGE motifs are indicated by solid lines. Seven lysine residues (K) within the α-helix are in boldface type and double underlined. (B) 13Cα-13Cβ CSI of mouse Neh2 plotted against residue number. Consecutive positive CSI values (>1) indicate an α-helix, whereas negative values (<−0.5) indicate a β-strand. Based on the CSI values, the secondary structural elements, the starts and ends of which have been labeled by residue number, are shown above the plot. (C) A chart showing the steady-state 1H-{15N} heteronuclear NOEs of Neh2 and indicating the backbone dynamics of the protein. Asterisks denote values of zero. Overall heteronuclear NOE values are equal or less than 0.5. (D) Schematic diagram of the mini antiparallel β-sheet (Phe-74 to Pro-85), where the ETGE motif (Glu-79 to Glu-82) forms a hydrophilic hairpin loop. (E) A helical wheel representation of the central α-helix from Phe-39 to Phe-71. Following the direction of the arrow, the helical wheel starts at Phe-39 (underlined) in the inner circle and ends at Phe-71 (underlined) in the outer circle. All seven lysines (K) are shown in boldface type. The dashed line divides the helical wheel into two equal parts, highlighting the concentration of the six lysines lying on one half of the helical surface.
FIG. 3.
FIG. 3.
Two binding sites for Keap1 reside in Neh2 that differ in their affinities by 2 orders of magnitude. A representative ITC profile of the titration of Keap1-DC with Neh2 is shown. The upper panel shows the raw ITC thermograms, and the lower panel shows the fitted binding isotherms. The two phases on the curve represent the higher (I) and lower (II) binding affinities in the two binding sites of Neh2.
FIG. 4.
FIG. 4.
The ETGE motif marks the initiation of binding between Neh2 and Keap1. 1H, 15N-TROSY-HSQC spectra of [15N]Leu-labeled Neh2 (A) and its complex with a 1 (B) or 1.75 (C) molar ratio of unlabeled Keap1-DC. Only 1H, 15N cross peaks for leucine residues are visible on the spectra. (A) Leucine peaks representing the β-sheet of Neh2 are labeled in blue (Leu-76 and Leu-84). (B) Leucine peaks representing the putative second binding site upstream of the central α-helix (Leu-19, Leu-23, and Leu-30, labeled in green) and the α-helix (Leu-48, Leu-54, and Leu-62, labeled in red) of Neh2 are shown. (C) Leucine peaks representing the very flexible N-terminal ends are labeled in black (Leu-4, Leu-6, and Leu-11).
FIG. 5.
FIG. 5.
The ETGE motif and DLG motifs constitute the stronger and weaker binding sites, respectively, to Keap1. (A) Schematic presentation of expression constructs for the Neh2 domain and its deletion mutants for ITC and NMR studies. (B to D) Representative ITC titration profiles for the titration of Keap1-DC with Neh2[ΔETGE] (B), Neh2[Δ1-33] (C), and Neh2[Δ1-33, ΔETGE] (D). The upper panels represent the raw ITC thermograms, and the lower panels represent the fitted binding isotherms. The integrated binding isotherms are plotted against the molar ratio of different mutants of Neh2. A single-site binding model fits best the single-phase curve for the titration with Neh2[ΔETGE] and Neh2[Δ1-33]. Neh2[Δ1-33, ΔETGE] shows heat change similar to that of the heat of dilution of the proteins.
FIG. 6.
FIG. 6.
Neh2 binds two molecules of Keap1-DC through both the ETGE and DLG motifs. (A to F) 1H, 15N-TROSY-HSQC spectra of [15N]Arg-labeled Keap1-DC (0.3 mM) (A) titrated with 0.15 mM Neh2 (B), 0.3 mM Neh2 (C), 0.3 mM Neh2[Δ1-33, ΔETGE] (D), 0.6 mM Neh2[ΔETGE] (E), and 0.3 mM Neh2[Δ1-33] (F). The assigned resonances for Arg-380, Arg-415, Arg-460, and Arg-483 of Keap1-DC are as indicated in panel A. Panels C, E, and F show overlaid spectra of the unbound (black) and bound (red) states of the [15N]Arg-labeled Keap1-DC with the respective wild-type Neh2 or mutants. The resonances for Arg-380, Arg-415, and Arg-483 in their unbound states (black signals) are as indicated by arrows in green, blue, and magenta, respectively, on panels A, C, E, and F. Miniature cartoons at the top left corners of each spectrum show respective protein-protein interaction status, with hexagons in magenta representing Keap1-DC and green hockey sticks representing the Neh2 domain. (G) A zoomed spectral view showing Arg-460 resonance of [15N]Arg-labeled Keap1-DC in the course of titration with unlabeled Neh2[Δ1-33]. The red dotted line indicates the diminishing Arg-460 resonance in its unbound state, and the green dotted line indicates the appearing Arg-460 resonance in its bound state.
FIG. 7.
FIG. 7.
The DLG motif is the weaker Keap1 binding site within Met-17 to Val-36. 1H, 15N-TROSY-HSQC spectra of [15N]Arg-labeled Keap1-DC (0.3 mM) titrated with the DLG peptide of the Neh2 domain incurs spectral changes similar to those provoked by the Neh2[ΔETGE] mutant. An overlaid spectrum shows arginine resonance signals of unbound (black) and bound (red) states of the [15N]Arg-labeled Keap1-DC; the latter is in complex with a 20-amino-acid DLG peptide (Met-17 to Val-36) of the Neh2 domain. The color code for the arrows of Arg-380, Arg-415, and Arg-483 is the same as described for Fig. 6.
FIG. 8.
FIG. 8.
Single-arginine substitution mutation in Keap1-DC attenuates the binding affinity of Keap1-DC to the ETGE peptide. (A, B) ITC titration profiles showing the titration of Keap1-DC (A) and Keap1-DC-R415K mutant (B) with the ETGE peptide (Leu-76 to Leu-84) of the Neh2 domain. Note that the integrated binding isotherms fit best for a one-site binding model.
FIG. 9.
FIG. 9.
Two-site molecular recognition model for Keap1 and Neh2 interaction. (A) Binding model of Keap1 and Neh2. Keap1 forms a homodimer through intermolecular interaction of its BTB domain. IVR (in gray) connects the BTB domain with the β-propeller structure of the DGR/CTR domain (Keap1-DC, pink hexagons) of Keap1. The Neh2 domain (in green) is recruited to one molecule of the Keap1-DC via the ETGE motif within the antiparallel β-sheet (green arrowheads) and the DLG motif upstream of the central α-helix to an overlapping site on another molecule of Keap1-DC. The central α-helix (green rod) of Neh2 serves as a bridge between the two molecules of Keap1. Lysine residues within the central α-helix are labeled K in the schematic model. Binding of the DLG motif with Keap1 may help to correctly orientate these lysines in space for other biological functions. The arginine triad (Arg-380, Arg-415, and Arg-483) at the entrance of the central channel of Keap1 is shown as solid blue circles. (B) A space-filled model generated by InsightII (Accelrys) and the coordinates of the mouse Keap1-DC (47a) (PDB accession code 1X2J), showing the bottom view of the molecule. The six Kelch repeats are as numbered. Arginine residues located on the bottom surface are shown as blue sticks. The three arginines (Arg-380, Arg-415, and Arg-483) that are involved in protein-protein interaction with the Neh2 domain are labeled.

References

    1. Adams, J., R. Kelso, and L. Cooley. 2000. The kelch repeat superfamily of proteins: propellers of cell function. Trends Cell Biol. 10:17-24. - PubMed
    1. Bakin, A. V., N. V. Stourman, K. R. Sekhar, C. Rinehart, X. Yan, M. J. Meredith, C. L. Arteaga, and M. L. Freeman. 2005. Smad3-ATF3 signaling mediates TGF-beta suppression of genes encoding phase II detoxifying proteins. Free Radic. Biol. Med. 38:375-387. - PubMed
    1. Balaban, R. S., S. Nemoto, and T. Finkel. 2005. Mitochondria, oxidants, and aging. Cell 120:483-495. - PubMed
    1. Bardwell, V. J., and R. Treisman. 1994. The POZ domain: a conserved protein-protein interaction motif. Genes Dev. 8:1664-1677. - PubMed
    1. Chen, C., and A. N. Kong. 2004. Dietary chemopreventive compounds and ARE/EpRE signaling. Free Radic. Biol. Med. 36:1505-1516. - PubMed

Publication types

MeSH terms

Substances