. 2006 Jun 15;573(Pt 3):611-25.
doi: 10.1113/jphysiol.2006.109819. Epub 2006 Mar 31.

Glucagon activates Ca2+ and Cl- channels in rat hepatocytes

Affiliations

Glucagon activates Ca2+ and Cl- channels in rat hepatocytes

Edoardo C Aromataris et al. J Physiol. .

Abstract

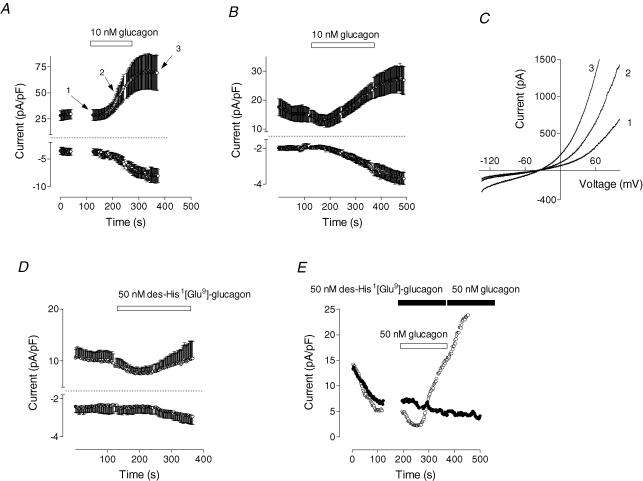
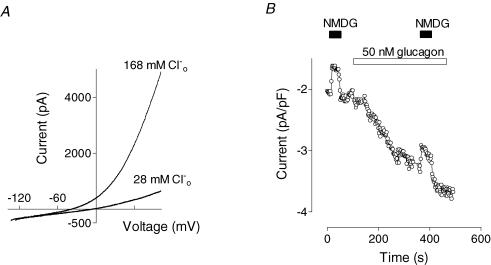
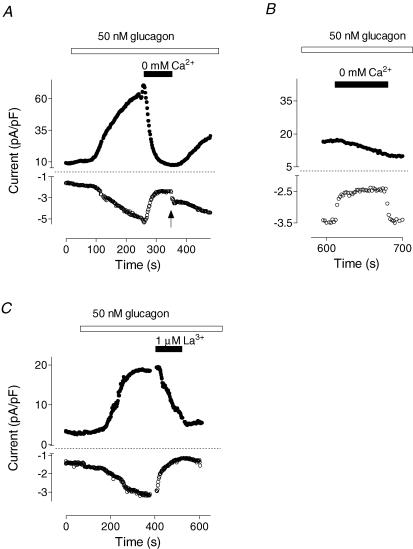
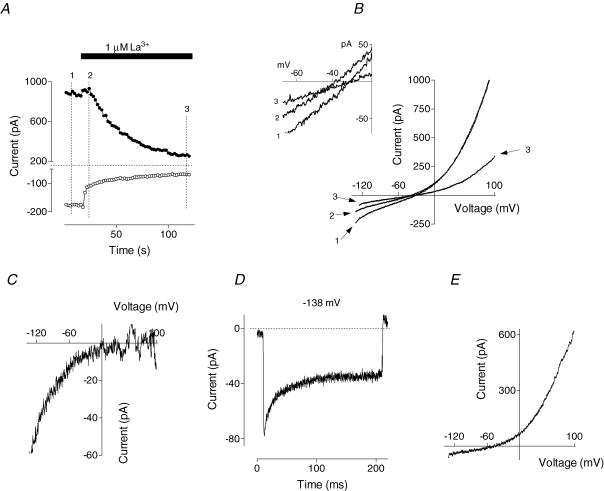
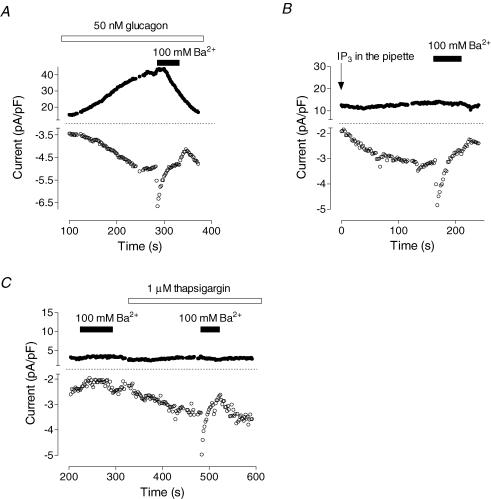
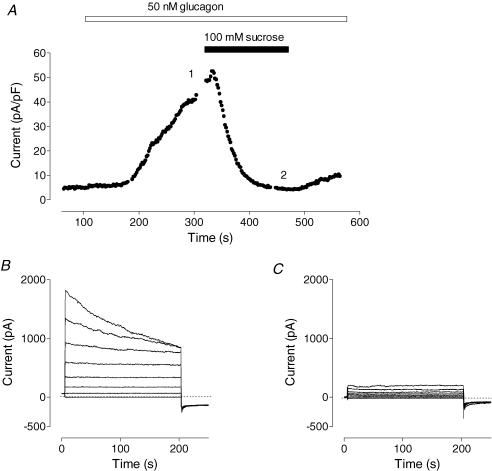
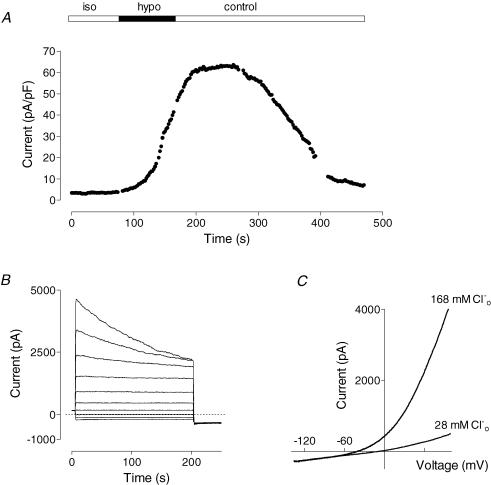
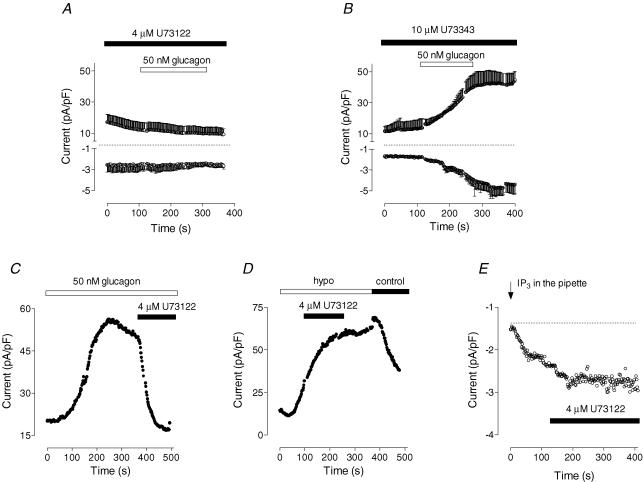
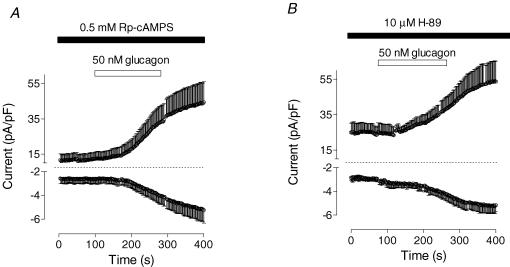
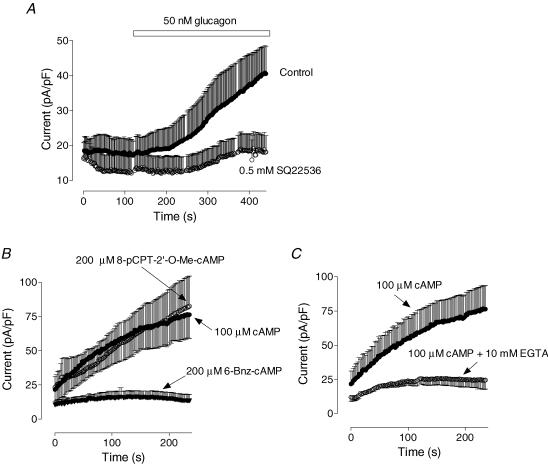
Glucagon is one of the major hormonal regulators of glucose metabolism, counteracting the hepatic effects of insulin when the concentration of glucose in the bloodstream falls below a certain level. Glucagon also regulates bile flow, hepatocellular volume and membrane potential of hepatocytes. It is clear that changes in cell volume and membrane potential cannot occur without significant ion fluxes across the plasma membrane. The effects of glucagon on membrane currents in hepatocytes, however, are not well understood. Here we show, by patch-clamping of rat hepatocytes, that glucagon activates two types of currents: a small inwardly rectifying Ca2+ current with characteristics similar to those of the store-operated Ca2+ current and a larger outwardly rectifying Cl- current similar to that activated by cell swelling. We show that the mechanism of glucagon action on membrane conductance involves phospholipase C and adenylyl cyclase. Contribution of the adenylyl cyclase-dependent pathway to activation of the currents depended on Epac (exchange protein directly activated by cAMP), but not on protein kinase A. The activation of Ca2+ and Cl- channels is likely to play a key role in the mechanisms by which glucagon regulates hepatocyte metabolism and volume.


Figures

Figure 1
Figure 1. Effect of glucagon on membrane conductance in rat hepatocytes
A and B show the time course of the development of the inward and outward current in response to glucagon (10 nm) in perforated-patch (A, n = 5) and whole-cell experiments (B, n = 15). Current amplitudes were taken from the responses to the voltage ramps at −118 and +82 mV for the inward and the outward current, respectively, normalized to the cell capacitance and plotted against time. Application of glucagon is indicated by a horizontal bar. C, examples of the IV plots obtained in response to voltage ramps between −138 and +102 mV before application of glucagon (trace 1, see A), at the beginning of the glucagon response (trace 2), and when the currents are fully developed (trace 3). D, lack of effect of the glucagon receptor antagonist des-His1[Glu9]-glucagon amide (50 nm) on membrane conductance (n = 8). E, inhibition of the glucagon response (50 nm) by des-His1[Glu9]-glucagon amide (50 nm; •; representative cell, n = 5). For comparison, a response to glucagon (50 nm) is shown in a representative cell from the same preparation (○).
Figure 2
Figure 2. Effects of ion substitution on glucagon-activated conductance
A, effect of Cl replacement in the external solution with an equimolar amount of glutamate on the outward current shown in a representative cell (n = 5). B, effect of replacement of Na+ in the external solution with NMDG+ on inward current shown in a representative cell (n = 4). NMDG+ was perfused both before and after development of the glucagon response.
Figure 3
Figure 3. Effects of removal of extracellular Ca2+ and addition of La3+ on the currents activated by glucagon
A and B show the effect of removal of Ca2+ from the external solution on both the inward and outward currents at early (A) and late stages (B) of the glucagon response shown in a representative cell (n = 5). CaCl2 was replaced with MgCl2. Arrow shows the point when Ca2+ was added back to the bath. C, inhibition of the glucagon response by La3+ shown in a representative cell (n = 8).
Figure 4
Figure 4. Separation of the currents inhibited by La3+
A, time course of La3+ block (results similar to those in Fig. 3C are shown using an expanded time scale). Marks 1, 2 and 3 correspond to time points before application of La3+, just after application of La3+ when only inward current is blocked, and after the complete development of the block, respectively. B, the IV plots of the currents recorded before addition of La3+ (trace 1), at 10 s (trace 2) and at 90 s (trace 3) after La3+ addition (cf. corresponding numbers in A). Inset shows currents around the reversal potential. C, the IV plot of the current blocked by La3+ within first 5–10 s (obtained by subtraction of trace 2 from trace 1 shown in B). D, the same current as in C, but recorded in response to a voltage step to −138 mV. E, the IV plot of the current inhibited by La3+ between 10 and 120 s of application (obtained by subtraction of trace 3 from trace 2 shown in B).
Figure 5
Figure 5. Activation of Ba2+-permeable channels in rat hepatocytes by glucagon and depletion of intracellular Ca2+ stores
A, effect of replacement of the control external solution with solution containing 100 mm Ba2+ on the currents activated by glucagon (representative cell, n = 6). B, effect of 100 mm Ba2+ on store-operated Ca2+ current activated by intracellular perfusion with 20 μm IP3 (representative cell, n = 9). C, effect of 100 mm Ba2+on store-operated Ca2+ current activated by 1 μm thapsigargin (representative cell, n = 3). Note absence of the effect when Ba2+ was applied before thapsigargin.
Figure 6
Figure 6. Cl conductance activated by glucagon is inhibited by hepatocyte shrinkage
A, effect of addition of 100 mm sucrose to the external solution on the Cl currents activated by glucagon. B and C show membrane currents recorded in response to voltage steps ranging between −98 and +82 mV in 20 mV increments in isotonic and hypertonic solutions, respectively. Results shown in a representative cell (n = 4).
Figure 7
Figure 7. Hepatocyte swelling activates Cl current similar to that activated by glucagon
A, time course of Cl current development in hypotonic solution and inhibition upon return to control bath solution. Initially, cell was perfused with isotonic solution in which 50 mm NaCl was replaced with 100 mm sucrose, which subsequently was changed to hypotonic solution lacking 100 mm sucrose (see Methods; representative cell, n = 4). B, membrane currents activated by swelling recorded in control solution in response to voltage steps ranging between −98 and +82 mV in 20 mV increments. C, IV plots of the membrane currents activated by swelling in control solution and in solution in which 140 mm NaCl was replaced with 140 mm sodium glutamate.
Figure 8
Figure 8. Effect of the PLC inhibitor U73122 on the glucagon response
A, U73122 (4 μm) prevents development of the glucagon response (50 nm; n = 4). B, U73343, which is an inactive analogue of U73122, had no effect on the glucagon response. C, U73122 (4 μm) inhibits Cl current activated by glucagon (representative cell, n = 4). D, U73122 (4 μm) has no effect on Cl current activated by cell swelling (representative cell, n = 3). E, U73122 (4 μm) has no effect on Ca2+ current activated by intracellular perfusion with 20 μm IP3 (representative cell, n = 3).
Figure 9
Figure 9. Inhibition of PKA-dependent pathway has no effect on glucagon-activated conductance
A, effect of Rp-cAMPS (500 μm in the pipette solution) on glucagon response (50 nm; n = 3). B, effect of PKA inhibitor, H-89 (10 μm), on glucagon response (50 nm; n = 3). Cells were incubated for 20 min with H-89 before application of glucagon.
Figure 10
Figure 10. cAMP activates Cl conductance in hepatocytes by activating Epac
A, inhibition of the glucagon response by the inhibitor of adenylyl cyclase SQ22536 (n = 4). SQ22536 (0.5 mm) was applied to the bath solution for at least 5 min prior to addition of glucagon. B, effects of cAMP (100 μm in the pipette solution) and its analogues 8-pCPT-2′-O-Me-cAMP (200 μm in the pipette solution) and 6-Bnz-cAMP (200 μm in the pipette solution) on the outward conductance of rat hepatocytes. C, dependence of the cAMP-activated Cl conductance on intracellular Ca2+. Calcium concentration was either weakly buffered to ∼120 nm by 1 mm EGTA, or strongly buffered to ∼10 nm by 10 mm EGTA.

References

    1. Alvaro D, Della Guardia P, Bini A, Gigliozzi A, Furfaro S, La Rosa T, Piat C, Capocaccia L. Effect of glucagon on intracellular pH regulation in isolated rat hepatocyte couplets. J Clin Invest. 1995;96:665–675. - PMC - PubMed
    1. Barry PH. JPCalc, a software package for calculating liquid junction potential corrections in patch-clamp, intracellular, epithelial and bilayer measurements and for correcting junction potential measurements. J Neurosci Meth. 1994;51:107–116. - PubMed
    1. Berridge MJ. Inositol trisphosphate and calcium signalling. Nature. 1993;361:315–325. - PubMed
    1. Berry MN, Edwards AM, Barritt GJ. High-yield preparation of isolated hepatocytes from rat liver. In: Burdon R H, van Knippenberg PH, editors. Laboratory Techniques in Biochemistry and Molecular Biology. Vol. 21. Amsterdam: Elsevier; 1991. pp. 15–81.
    1. Birnbaum MJ, Fain JN. Activation of protein kinase and glycogen phosphorylase in isolated rat liver cells by glucagon and catecholamines. J Biol Chem. 1977;252:528–535. - PubMed

Publication types

MeSH terms

LinkOut - more resources