. 2007 Feb;17(2):475-91.
doi: 10.1093/cercor/bhj164. Epub 2006 Mar 31.

The ferret auditory cortex: descending projections to the inferior colliculus

Affiliations

The ferret auditory cortex: descending projections to the inferior colliculus

Victoria M Bajo et al. Cereb Cortex. 2007 Feb.

Abstract

Descending corticofugal projections are thought to play a critical role in shaping the responses of subcortical neurons. Here, we examine the origins and targets of ferret auditory corticocollicular projections. We show that the ectosylvian gyrus (EG), where the auditory cortex is located, can be subdivided into middle, anterior, and posterior regions according to the pattern of cytochrome oxidase staining and immunoreactivity for the neurofilament antibody SMI32. Injection of retrograde tracers in the inferior colliculus (IC) labeled large layer V pyramidal cells throughout the EG and adjacent sulci. Each region of the EG has a different pattern of descending projections. Neurons in the primary auditory fields in the middle EG project to the lateral nucleus (LN) of the ipsilateral IC and bilaterally to the dorsal cortex and dorsal part of the central nucleus (CN). The projection to these dorsomedial regions of the IC is predominantly ipsilateral and topographically organized. The secondary cortical fields in the posterior EG target the same midbrain areas but exclude the CN of the IC. A smaller projection to the ipsilateral LN also arises from the anterior EG, which is the only region of auditory cortex to target tegmental areas surrounding the IC, including the superior colliculus, periaqueductal gray, intercollicular tegmentum, and cuneiform nucleus. This pattern of corticocollicular connectivity is consistent with regional differences in physiological properties and provides another basis for subdividing ferret auditory cortex into functionally distinct areas.


Conflict of interest statement

Conflict of Interest: None declared.

Figures

Figure 1
Figure 1
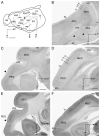
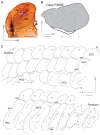
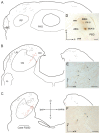
(A) Lateral view of the ferret brain showing the different gyri and sulci in the cortex. The ferret auditory cortex is located in the EG. The square in (A) indicates the area shown at higher magnification in (B); vertical lines (CE, DF) depict the level and plane of sections shown in (C-F). (B) Section cut tangentially, flattened, and immunostained with the SMI32 antibody. A bilaminar pattern of staining is prominent in the primary region in the MEG, less so in the AEG, and is absent in the PEG. Thin arrows indicate borders between MEG and AEG/PEG. The most anterior part of the AEG is characterized by intense staining in layer II/III (empty arrow marks the posterior limit of this). In the most ventral part of the PEG, SMI32 immunoreactivity was almost absent (below arrowheads). (C, D) Sections cut in the coronal plane and stained with the SMI32 antibody. In (C), the bilaminar pattern in AEG is transformed to a monolaminar pattern in dorsal PEG, which disappears in ventral PEG (as indicated by the arrowhead). (E, F) Sections cut in the coronal plane and stained for CO. In (E), PEG is weakly stained for CO, whereas in AEG the staining is strong and uniform in the supragranular layers. In PEG, the most ventral region is more weakly stained than the dorsal region (arrowhead). In (F), robust staining of layer IV is characteristic of MEG (arrow indicates the border between MEG and PEG). Scale bar is 5 mm in (A) and 1 mm in (B-F). ASG, anterior sigmoid gyrus; as, ansinate sulcus; CNG, coronal gyrus; cns, coronal sulcus; crs, cruciate sulcus; LG, lateral gyrus; ls, lateral sulcus; M, medial; OB, olfactory bulb; OBG, orbital gyrus; P, posterior; prs, presylvian sulcus; PSG, posterior sigmoid gyrus; RC, rhinal cortex; rf, rhinal fissure; SSG, suprasylvian gyrus; V, ventral.
Figure 2
Figure 2
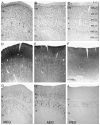
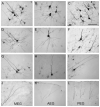
Cytoarchitectonic features observed in the MEG, AEG, and PEG. Figures from MEG, AEG, and PEG are organized in 3 columns to show Nissl (A-C), CO (D-F), and SMI32 antibody staining (G-I) in different rows. With Nissl staining, cell density is highest and the granular appearance of the supragranular layers strongest in MEG (A), weakest in PEG (C), and intermediate in AEG (B). CO staining is strongest in the supragranular layers, although some CO-positive layer V neurons can also be observed (arrows). The supragranular CO staining is strong in MEG (D), intermediate in AEG (E), and weak in the PEG (F). Immunostaining with the SMI32 neurofilament antibody reveals a bilaminar pattern in MEG (G) and AEG (H), whereas in PEG there is only a monolaminar pattern of layer V positive neurons (I). The dashed lines indicate the borders of the different cortical layers, which were determined on the basis of the Nissl, CO, and SMI32 staining. Scale is shown in (C).
Figure 3
Figure 3
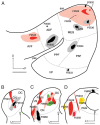
Drawings showing the location and size of the tracer ISs in the auditory cortex (A) and in the IC (B-D) of all the animals (except F0061) used in this study. The EG is shown in a lateral view (A) and the IC is shown at 3 different coronal levels from caudal (B) to rostral (D). The red color range was chosen to illustrate FR and Red Retrobead ISs, the yellow range for FG, and gray-black for BDA. Green Retrobead ISs are indicated by the green area. A center and a halo in the IS could be distinguished when FG, FR, and BDA were used and are illustrated using dark and light color ranges. No halo was present with the Retrobead injections because no tracer diffusion occurs with this tracer. Because multiple tracer injections were made in case F0061, its ISs are not included in this figure. Scale bars represent 2 mm in (A) and 1 mm in (B-D). D, dorsal; L, lateral; P, posterior.
Figure 4
Figure 4
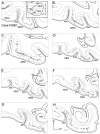
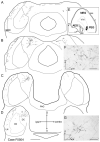
Location of cortical neurons that form the descending projection to the midbrain. Multiple FR injections in the ipsilateral IC (case F0061) retrogradely labeled neurons in layer V across the entire extent of the EG, including both sss and pss. The drawings show the labeling of cellular bodies and apical dendrites at different dorsoventral levels of the EG, as schematized in the inset in (A). Scale bar in (H) is 1 mm. HP, hippocampus; LV, lateral ventricle; M, medial; P, posterior; rf, rhinal fissure; SSG, suprasylvian gyrus; V, ventral.
Figure 5
Figure 5
Morphology of the cortical neurons projecting to the IC. Left column (A, D, G, J) shows neurons located in the MEG, middle column (B, E, H, K) in the AEG, and right column (C, F, I, L) in the PEG. Every neuron comes from animal F0061. In all cases, the labeled apical dendrite is oriented perpendicular to the white matter and toward the pial surface. Scale bar in (C) is 100 μm.
Figure 6
Figure 6
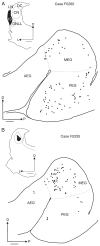
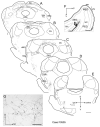
Location of cortical cells retrogradely labeled by a restricted FR injection in the IC (case F9969). The IS (A) is centered in the middle of the CN, and the tracer spread following the dorsomedial to ventrolateral laminar orientation of the nucleus to reach the DC. Labeled cells are located mainly in the MEG and PEG and are less frequent in the AEG. This is shown in (C) on coronal sections taken at the rostrocaudal levels indicated in (B). A BDA injection is also located in the LN (A), which produced labeling equivalent to that shown in Figure 7 for a different LN injection. For clarity, however, no retrogradely labeled BDA cells are illustrated here. Scale bar is 1 mm in (A), 5 mm in (B), and 2 mm in (C). D, dorsal; DNLL, dorsal nucleus of the lateral lemniscus; L, lateral; l.s. lateral sulcus; M, medial; P, posterior; rf, rhinal fissure; SSG, suprasylvian gyrus.
Figure 7
Figure 7
Examples showing the distribution of cortical cells labeled retrogradely by restricted tracer injections in the IC. In (A) (case F0260), an FR IS is located in the LN, spreading ventrally to the nucleus of the sagulum (Sag). Labeled cells in the ipsilateral EG are located mainly in the PEG and MEG, with virtually none in the AEG. In (B) (case F0255), an injection of green retrobeads was made in the CN, and most of the labeled cells are restricted to the MEG. Dot lines indicate the limits of the MEG. The EG was reconstructed from flattened horizontal sections taken every 300 μm. Scale bars represent 1 mm. D, dorsal; DNLL, dorsal nucleus of the lateral lemniscus; L, lateral; P, posterior.
Figure 8
Figure 8
Anterograde labeling in the IC observed after an injection of FR in the MEG. In (A), the IS is shown in a coronal section at the level of the left MEG. The halo of the IS spread along the MEG. Examples of labeled terminal fields in the ipsilateral LN and CN and in the contralateral CN are shown in (B), (C), and (D). The terminal fields have a distinctive orientation in every IC subdivision. Details of the terminal fields in the CN are shown in (C) and (D), ipsilateral and contralateral to the IS, respectively. Arrows indicate terminal boutons and the dashed lines in (C) the orientation of the terminal fields in the CN. A drawing at the level of the center of both ICs is shown in (E), illustrating the distribution of the terminal fields. Scale bars represent 1 mm in (A), 100 μm in (B-D), and 500 μm in (E). contra, contralateral; D, dorsal; HP, hippocampus; ipsi, ipsilateral; L, lateral; LV, lateral ventricle; SSG, suprasylvian gyrus.
Figure 9
Figure 9
Anterograde labeling in the IC observed after 2 restricted tracer injections located in the MEG. FR and BDA were injected in the dorsal and ventral part of the MEG, respectively (D). Drawings at different IC rostrocaudal levels (A-C) show terminal fields in the 3 subdivisions of the ipsilateral IC. The contralateral labeling is much weaker and appears to show a similar pattern. The location of the terminal fields in the IC is related to the IS in the MEG. FR terminal fields are drawn in red, and BDA terminal fields in black. Details of red and black terminals are shown in (E) and (F), respectively, with arrows pointing at labeled terminals. Scale bar in (A-D) is 1 mm and in (E) and (F) is 50 μm. contra, contralateral; D, dorsal; ipsi, ipsilateral; LL, lateral lemniscus; M, medial; nBIC, nucleus of the brachium of the inferior colliculus; P, posterior; RP, rostral pole of the inferior colliculus; V, ventral.
Figure 10
Figure 10
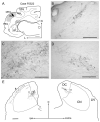
Anterograde labeling observed in the IC after a BDA injection in the PEG. Sections are ordered from rostral to caudal (A-D). The terminal fields are located in the ipsilateral LN and in the DC bilaterally. Some labeled fibers are observed in the nucleus of the brachium of the inferior colliculus (nBIC). The IS is shown in (E), and details of the terminal fields in the ipsilateral DC are shown in (F) and (G), with arrows pointing at labeled terminals. In general, these terminals are larger than those shown in Figures 7 and 8. Scale bar is 1 mm in (A-D), 2 mm in (E), and 50 μm in (F) and (G). I, Layer I of the cortex; contra, contralateral; D, dorsal; ipsi, ipsilateral; M, medial; P, posterior; V, ventral.
Figure 11
Figure 11
Anterograde labeling at the level of the IC observed after a BDA injection in the AEG. (A-E) drawings from rostral to caudal (300 μm apart) showing the terminal fields located bilaterally in the deeper layers of the SC and in the PAG. Ipsilaterally, terminal fields are found in the nucleus of the sagulum (Sag), nucleus of the brachium of the inferior colliculus (nBIC), LN, CN, ventral tegmental part of the IC, and surrounding paralemniscal regions and pontine nuclei. The IS is shown in (F) on a drawing of a flattened tangential section of the EG at the level of the center of this site. The main target is the PAG and examples of terminals found there are shown in (G). The terminal fields in PAG exhibit a low terminal density. Scale bar is 1 mm (A-E), 2 mm in (F), and 50 μm in (G). I, layer I of the cortex; II/IV, layers from II to IV of the cortex; contra, contralateral; Cu, cuneiform nucleus; D, dorsal; DNLL, dorsal nucleus of the lateral lemniscus; ipsi, ipsilateral; M, medial; P, posterior; V, ventral; VNLL, ventral nucleus of the lateral lemniscus; w.m., white matter.
Figure 12
Figure 12
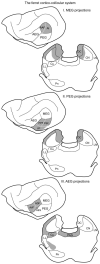
Summary of the origin and distribution of descending corticocollicular projections in the ferret. Projections originating in the primary cortical fields target the LN of the IC on the same side and the DC and dorsal part of the CN on both sides. Neurons in the secondary auditory cortical fields on the PEG have the same targets as those located in primary areas but exclude the CN. Neurons located in the AEG primarily innervate the tegmental midbrain. Cu, cuneiform nucleus; LL, lateral lemniscus; Pn, pontine nuclei.

Similar articles

Cited by

References

    1. Adams JC. Heavy metal intensification of DAB-based HRP reaction product. J Histochem Cytochem. 1981;29:775. - PubMed
    1. Aitkin LM, Kenyon CE, Philpott P. The representation of the auditory and somatosensory systems in the external nucleus of the cat inferior colliculus. J Comp Neurol. 1981;196:25–40. - PubMed
    1. Alitto HJ, Usrey WM. Corticothalamic feedback and sensory processing. Curr Opin Neurobiol. 2003;13:440–445. - PubMed
    1. Bajo VM, Moore DR. Central Auditory Processing: Integration of Auditory and Non-Auditory Information. Monte Verita/Ascona; Switzerland: 2002. May, [Accessed 20 March 2006]. Convergence of ascending and descending auditory pathways in the ferret inferior colliculus. 2002 12-15, http://www.unifr.ch/neuro/rouiller/pdf/abstractbookfinal.pdf.
    1. Bajo VM, Moore DR. Descending projections from the auditory cortex to the inferior colliculus in the gerbil, Meriones unguiculatus . J Comp Neurol. 2005;486:101–116. - PubMed

Publication types

MeSH terms