

A bond graph model of the cardiovascular system
- PMID: 16583271
- PMCID: PMC2588344
- DOI: 10.1007/s10441-005-4881-4
A bond graph model of the cardiovascular system
Abstract
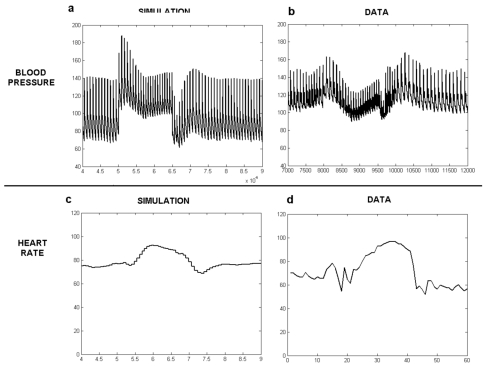
The study of the autonomic nervous system (ANS) function has shown to provide useful indicators for risk stratification and early detection on a variety of cardiovascular pathologies. However, data gathered during different tests of the ANS are difficult to analyse, mainly due to the complex mechanisms involved in the autonomic regulation of the cardiovascular system (CVS). Although model-based analysis of ANS data has been already proposed as a way to cope with this complexity, only a few models coupling the main elements involved have been presented in the literature. In this paper, a new model of the CVS, representing the ventricles, the circulatory system and the regulation of the CVS activity by the ANS, is presented. The models of the vascular system and the ventricular activity have been developed using the Bond Graph formalism, as it proposes a unified representation for all energetic domains, facilitating the integration of mechanic and hydraulic phenomena. In order to take into account the electro-mechanical behaviour of both ventricles, an electrophysiologic model of the cardiac action potential, represented by a set of ordinary differential equations, has been integrated. The short-term ANS regulation of heart rate, cardiac contractility and peripheral vasoconstriction is represented by means of continuous transfer functions. These models, represented in different continuous formalisms, are coupled by using a multi-formalism simulation library. Results are presented for two different autonomic tests, namely the Tilt Test and the Valsalva Manoeuvre, by comparing real and simulated signals.
Figures


References
-
- Barbieri R, Bianchi AM, Triedman JK, Mainardi LT, Cerutti S, Saul JP. Model dependency of multivariate autoregressive spectral analysis. IEEE Eng Med Biol Mag. 1997;16(5):74–85. - PubMed
-
- Bestel J. PhD thesis. University Paris 9; 2000. Modèle différentiel de la contractrion musculaire contrôlée: Application au système cardiovasculaire.
-
- Dauphin-Tanguy, et al. Les Bond Graphs, collection IC2. Hermes; 2000.
-
- DeBoer RW, Karemaker JM, Kara HH. Hemodynamic fluctuations and baroreflex sensitivity in human: a beat-to-beat model. J Appl Physiol. 1987;253:680–689. - PubMed
