

Chest wall mechanics during pressure support ventilation
- PMID: 16584534
- PMCID: PMC1550890
- DOI: 10.1186/cc4867
Chest wall mechanics during pressure support ventilation
Abstract
Introduction: During pressure support ventilation (PSV) a part of the breathing pattern is controlled by the patient, and synchronization of respiratory muscle action and the resulting chest wall kinematics is a valid indicator of the patient's adaptation to the ventilator. The aim of the present study was to analyze the effects of different PSV settings on ventilatory pattern, total and compartmental chest wall kinematics and dynamics, muscle pressures and work of breathing in patients with acute lung injury.
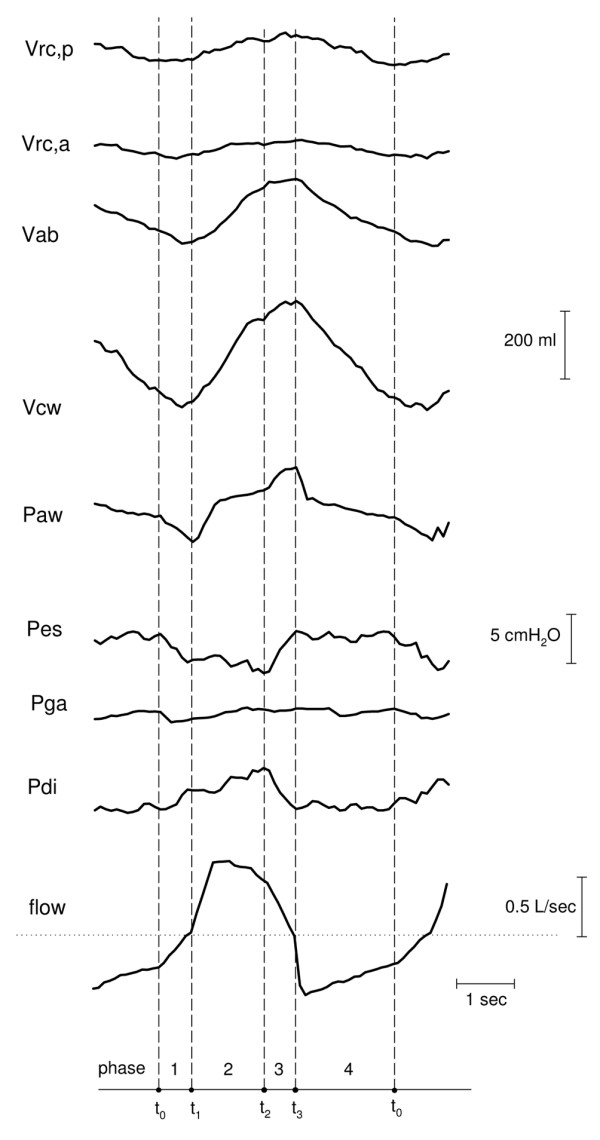
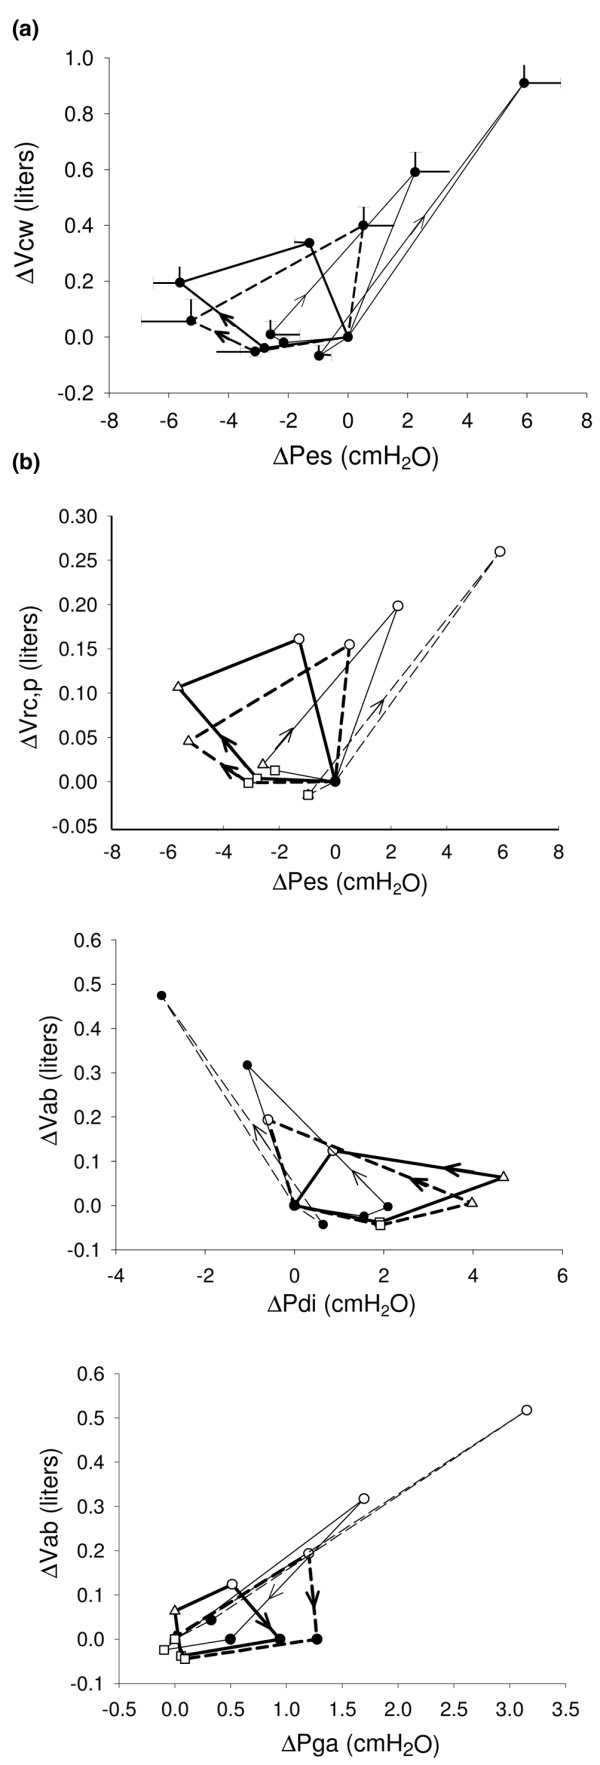
Method: In nine patients four different levels of PSV (5, 10, 15 and 25 cmH2O) were randomly applied with the same level of positive end-expiratory pressure (10 cmH2O). Flow, airway opening, and oesophageal and gastric pressures were measured, and volume variations for the entire chest wall, the ribcage and abdominal compartments were recorded by opto-electronic plethysmography. The pressure and the work generated by the diaphragm, rib cage and abdominal muscles were determined using dynamic pressure-volume loops in the various phases of each respiratory cycle: pre-triggering, post-triggering with the patient's effort combining with the action of the ventilator, pressurization and expiration. The complete breathing pattern was measured and correlated with chest wall kinematics and dynamics.
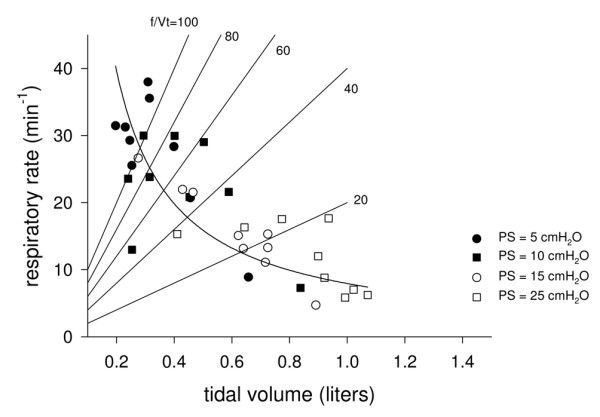
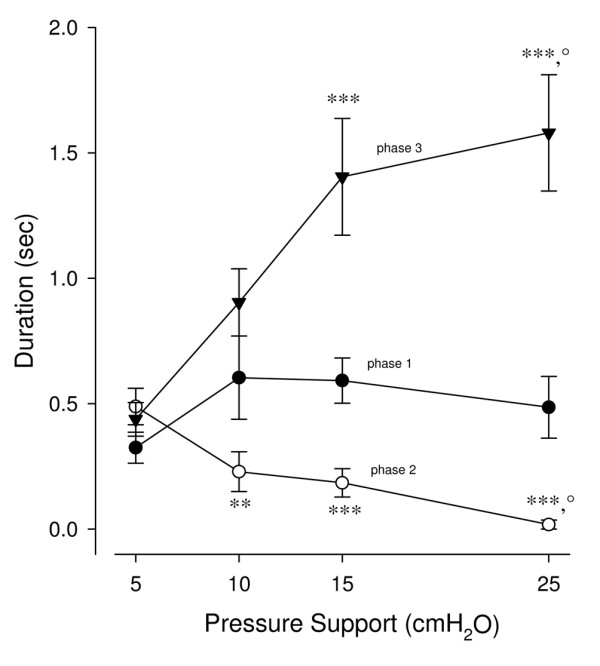
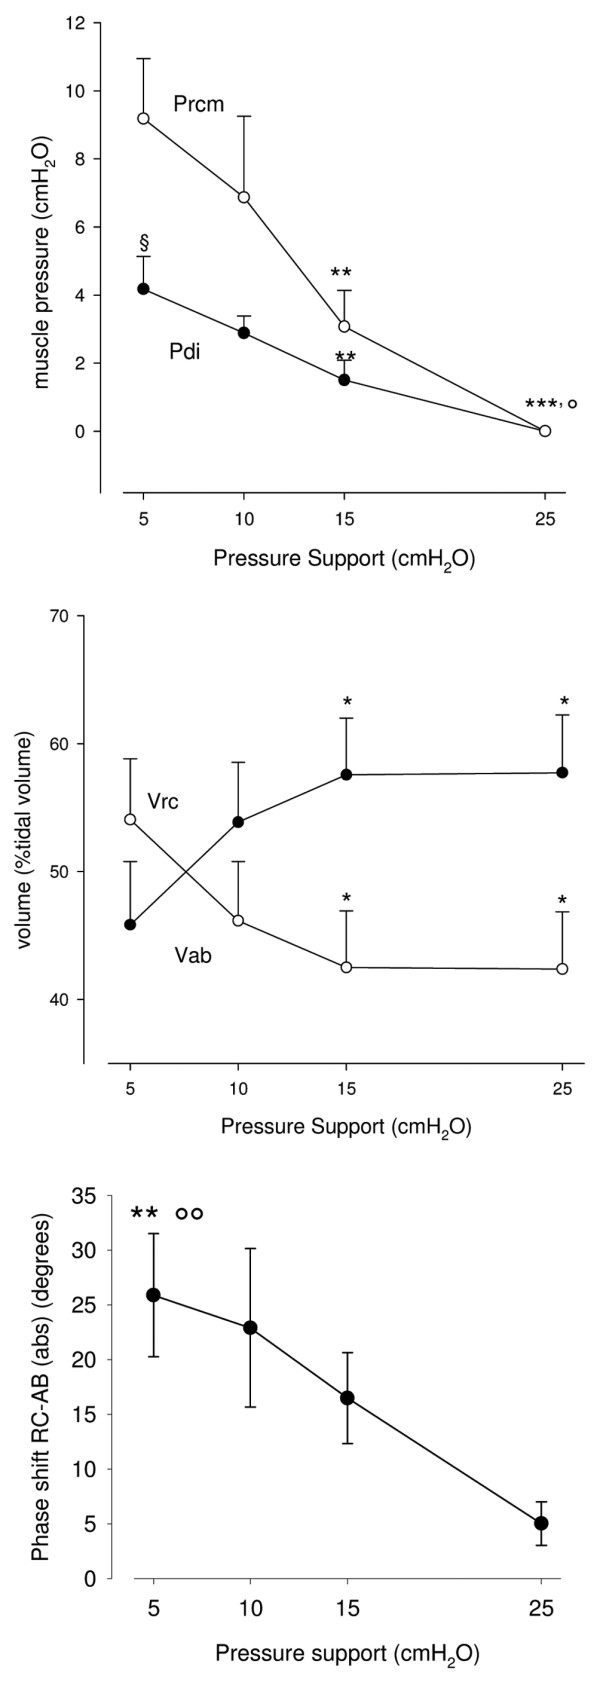
Results: At the various levels of pressure support applied, minute ventilation was constant, with large variations in breathing frequency/ tidal volume ratio. At pressure support levels below 15 cmH2O the following increased: the pressure developed by the inspiratory muscles, the contribution of the rib cage compartment to the total tidal volume, the phase shift between rib cage and abdominal compartments, the post-inspiratory action of the inspiratory rib cage muscles, and the expiratory muscle activity.
Conclusion: During PSV, the ventilatory pattern is very different at different levels of pressure support; in patients with acute lung injury pressure support greater than 10 cmH2O permits homogeneous recruitment of respiratory muscles, with resulting synchronous thoraco-abdominal expansion.
Figures
Similar articles
-
Effects of propofol anaesthesia on thoraco-abdominal volume variations during spontaneous breathing and mechanical ventilation.Acta Anaesthesiol Scand. 2011 May;55(5):588-96. doi: 10.1111/j.1399-6576.2011.02413.x. Epub 2011 Mar 8. Acta Anaesthesiol Scand. 2011. PMID: 21385159
-
Chest wall kinematics, respiratory muscle action and dyspnoea during arm vs. leg exercise in humans.Acta Physiol (Oxf). 2006 Sep;188(1):63-73. doi: 10.1111/j.1748-1716.2006.01607.x. Acta Physiol (Oxf). 2006. PMID: 16911254 Clinical Trial.
-
Differences in end-tidal carbon dioxide and breathing patterns in ventilator-dependent patients using pressure support ventilation.Am J Crit Care. 1994 Jul;3(4):276-81. Am J Crit Care. 1994. PMID: 7920956 Clinical Trial.
-
Effect of lung transplant and volume reduction surgery on respiratory muscle function.J Appl Physiol (1985). 2009 Sep;107(3):977-86. doi: 10.1152/japplphysiol.91620.2008. Epub 2009 Apr 9. J Appl Physiol (1985). 2009. PMID: 19359607 Review.
-
Experimental approaches to the study of the mechanics of breathing during exercise.Respir Physiol Neurobiol. 2012 Mar 15;180(2-3):147-61. doi: 10.1016/j.resp.2011.10.005. Epub 2011 Oct 14. Respir Physiol Neurobiol. 2012. PMID: 22019486 Review.
Cited by
-
An observational cohort study to determine efficacy, adherence and outcome of the early initiation of pressure support ventilation during mechanical ventilation.BMJ Open Respir Res. 2014 May 13;1(1):e000028. doi: 10.1136/bmjresp-2014-000028. eCollection 2014. BMJ Open Respir Res. 2014. PMID: 25478179 Free PMC article.
-
Development of a bio-inspired mechatronic chest wall simulator for evaluating the performances of opto-electronic plethysmography.Open Biomed Eng J. 2014 Dec 19;8:120-30. doi: 10.2174/1874120701408010120. eCollection 2014. Open Biomed Eng J. 2014. PMID: 25624954 Free PMC article.
-
Effect of Dual Bronchodilation on the Exercise Capacity of Individuals With Non-Cystic Fibrosis Bronchiectasis: Protocol for a Randomized Controlled Double-Blind Crossover Study.JMIR Res Protoc. 2025 Jul 28;14:e68582. doi: 10.2196/68582. JMIR Res Protoc. 2025. PMID: 40720815 Free PMC article.
-
Comparison between breathing and aerobic exercise on clinical control in patients with moderate-to-severe asthma: protocol of a randomized trial.BMC Pulm Med. 2014 Oct 17;14:160. doi: 10.1186/1471-2466-14-160. BMC Pulm Med. 2014. PMID: 25326140 Free PMC article. Clinical Trial.
-
Optoelectronic Plethysmography has Improved our Knowledge of Respiratory Physiology and Pathophysiology.Sensors (Basel). 2008 Dec 5;8(12):7951-7972. doi: 10.3390/s8127951. Sensors (Basel). 2008. PMID: 27873969 Free PMC article. Review.
References
-
- Esteban A, Anzueto A, Alia I, Gordo F, Apezteguia C, Palizas F, Cide D, Goldwaser R, Soto L, Bugedo G, et al. How is mechanical ventilation employed in the intensive care unit? An international utilization review. Am J Respir Crit Care Med. 2000;161:1450–1458. - PubMed
-
- Brochard L. Pressure support ventilation. In: Tobin MJ, editor. Principles and Practice of Mechanical Ventilation. New York: McGraw-Hill; 1994. pp. 239–257.
-
- Younes M. Interactions between patients and ventilators. In: Roussos C, editor. The Thorax. 2. New York: Marcel Dekker; 1995. pp. 2367–2420.
