. 2006;7(3):R25.
doi: 10.1186/gb-2006-7-3-r25. Epub 2006 Mar 31.

Ranked prediction of p53 targets using hidden variable dynamic modeling

Affiliations

Ranked prediction of p53 targets using hidden variable dynamic modeling

Martino Barenco et al. Genome Biol. 2006.

Abstract

Full exploitation of microarray data requires hidden information that cannot be extracted using current analysis methodologies. We present a new approach, hidden variable dynamic modeling (HVDM), which derives the hidden profile of a transcription factor from time series microarray data, and generates a ranked list of predicted targets. We applied HVDM to the p53 network, validating predictions experimentally using small interfering RNA. HVDM can be applied in many systems biology contexts to predict regulation of gene activity quantitatively.


Figures
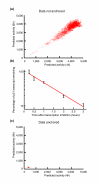
Figure 1
Figure 1
Model based estimation of activity profile of p53. (a) Markov Chain Monte Carlo output for potential transcription factor activity profile values for first time series replicate at 4 hours (x axis) and 6 hours (y axis). (b) Concentration of p21WAF1 transcript determined by real-time polymerase chain reaction after addition of actinomycin D (10 μg/ml) to irradiated (5 Gy, 4 hours) MOLT4 cells cultured in RPMI. Expressed as percentage of initial concentration. (c) Using the degradation rate of p21WAF1 dramatically restricted the range of solutions to the Markov Chain Monte Carlo.
Figure 2
Figure 2
Parameter estimation for a training set of five known p53 targets. (a) The model equation was solved to estimate values for the parameters basal transcription Bj sensitivity Sj, and degradation Dj for the five p53 targets DDB2, p21WAF1/CIP1, SESN1/hPA26, BIK, and TNFRSF10b/TRAILreceptor 2. (b) Simultaneously, the activity profile f(t) of p53 was derived from three separate microarray time courses.
Figure 3
Figure 3
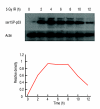
Experimentally determined p53 activity profile. The activity profile of p53 was measured by Western blot to determine the levels of ser-15 phosphorylated p53 (ser15P-p53). ser-15 phosphorylation is a measure of p53 activity. IR, ionizing radiation. IR, ionizing irradiation.
Figure 4
Figure 4
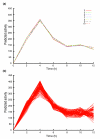
Choice and number of training set genes does not significantly affect the predicted activity profile. (a) Predicted activity profile of p53 derived using different numbers of known targets in the training set, from three to ten genes. (b) Predicted activity profile of p53 derived using 100 combinations of three randomly selected training set genes from a pool of 10 known targets.
Figure 5
Figure 5
Hidden variable dynamic modeling screening of upregulated genes. Model predicted profile (red) and experimental expression profile (black) of typical genes representing two classes of model prediction (class 1 and class 2). (a) Class 1 genes with good model score (M < 100) and high sensitivity P value (sensitivity Z score > 2; for example LRMP). (b) Class 1 genes with atypical expression profiles (for example, p53TG1); this profile occurs because of a low predicted degradation rate. (c,d) Two class 2 genes with low model score (M > 100) but high sensitivity P value (sensitivity Z score > 2; for example, TNFSF10 and IER3).
Figure 6
Figure 6
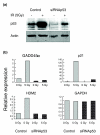
Small interfering (si)RNAp53 reduces p53 protein levels and transcription of p53 target genes. (a) Transfection of siRNAp53 reduces p53 protein levels below control values. (b) Real-time quantitative polymerase chain reaction measurement of three p53 target genes (GADD45α, p21, and HDM2) and a control gene (GAPDH) after transfection of siRNAp53 and irradiation. IR, ionizing irradiation.
Figure 7
Figure 7
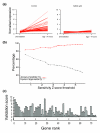
Model validation. (a) Effect of small interfering (si)RNAp53 on irradiation (5 Gy) induced change in transcript levels at 4 hours of the 74 class 1 genes. (b) Effect of altering Sj Z score threshold for class 1 on proportion of true targets identified (% of p53 upregulated genes at 4 hours predicted; black line) and accuracy of class 1 predictions (percentage of predictions made that were verified by siRNAp53; red line). Accuracy and proportion of the data explained reveal an inverse relationship. (c) Individual comparison of the effect of siRNAp53 on 74 class 1 genes with the best M and p53 sensitivity Sj score, ranked by sensitivity. Bars represent the validation score, a Z score measuring the effectiveness of siRNAp53 on reducing post-irradiation upregulation of transcript. Higher scores indicate effective blocking of the response.
Figure 8
Figure 8
Model performance. Distribution of 459 upregulated genes that pass degradation filter based on model score and predicted sensitivity to p53. Sj Z score = 3 and model = 100 thresholds are shown. A total of 115 Genes verified as p53 targets at 4 hours are shown in red.
Figure 9
Figure 9
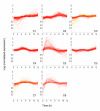
K means clustering of upregulated genes based on expression values. A total of 754 upregulated genes were optimally grouped into eight K means clusters (C1 to C8). The 50 best hidden variable dynamic modeling predictions (Table 1) are split among six clusters (highlighted in yellow). Accurate prediction of p53 targets is therefore not possible using K means at this level.

References

    1. Gardner TS, di Bernardo D, Lorenz D, Collins JJ. Inferring genetic networks and identifying compound mode of action via expression profiling. Science. 2003;301:102–105. doi: 10.1126/science.1081900. - DOI - PubMed
    1. Sontag E, Kiyatkin A, Kholodenko BN. Inferring dynamic architecture of cellular networks using time series of gene expression, protein and metabolite data. Bioinformatics. 2004;20:1877–1886. doi: 10.1093/bioinformatics/bth173. - DOI - PubMed
    1. Stark J, Brewer D, Barenco M, Tomescu D, Callard R, Hubank M. Reconstructing gene networks: what are the limits? Biochem Soc Trans. 2003;31:1519–1525. - PubMed
    1. Ronen M, Rosenberg R, Shraiman BI, Alon U. Assigning numbers to the arrows: parameterizing a gene regulation network by using accurate expression kinetics. Proc Natl Acad Sci USA. 2002;99:10555–10560. doi: 10.1073/pnas.152046799. - DOI - PMC - PubMed
    1. Chen HC, Lee HC, Lin TY, Li WH, Chen BS. Quantitative characterization of the transcriptional regulatory network in the yeast cell cycle. Bioinformatics. 2004;20:1914–1927. doi: 10.1093/bioinformatics/bth178. - DOI - PubMed

Publication types

Substances