

Multi-level gene expression profiles affected by thymidylate synthase and 5-fluorouracil in colon cancer
- PMID: 16584549
- PMCID: PMC1448211
- DOI: 10.1186/1471-2164-7-68
Multi-level gene expression profiles affected by thymidylate synthase and 5-fluorouracil in colon cancer
Abstract
Background: Thymidylate synthase (TS) is a critical target for cancer chemotherapy and is one of the most extensively studied biomarkers for fluoropyrimidine-based chemotherapy. In addition to its critical role in enzyme catalysis, TS functions as an RNA binding protein to regulate the expression of its own mRNA translation and other cellular mRNAs, such as p53, at the translational level. In this study, a comprehensive gene expression analysis at the levels of both transcriptional and post-transcriptional regulation was conducted to identify response markers using human genome array with TS-depleted human colon cancer HCT-C18 (TS-) cells and HCT-C18 (TS+) cells stably transfected with the human TS cDNA expression plasmid.
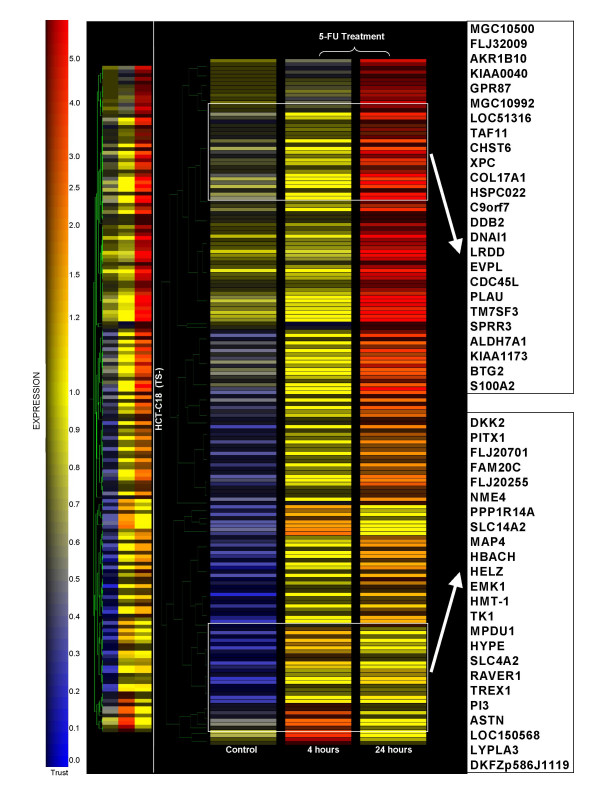
Results: A total of 38 genes were found to be significantly affected by TS based on the expression profiles of steady state mRNA transcripts. However, based on the expression profiles of polysome associated mRNA transcripts, over 149 genes were affected by TS overexpression. This indicates that additional post-transcriptionally controlled genes can be captured with profiling polysome associated mRNA population. This unique approach provides a comprehensive overview of genes affected by TS. Additional novel post-transcriptionally regulated genes affected by 5-fluorouracil (5-FU) treatment were also discovered via similar approach.
Conclusion: To our knowledge, this is the first time that a comprehensive gene expression profile regulated by TS and 5-FU was analyzed at the multiple steps of gene regulation. This study will provide candidate markers that can be potentially used for predicting therapeutic outcomes for fluoropyrimidine-based cancer chemotherapy.
Figures


Similar articles
-
The transfection of thymidylate synthase antisense suppresses oncogenic properties of a human colon cancer cell line and augments the antitumor effect of fluorouracil.Int J Oncol. 2004 Jan;24(1):217-22. Int J Oncol. 2004. PMID: 14654960
-
Differentially regulated micro-RNAs and actively translated messenger RNA transcripts by tumor suppressor p53 in colon cancer.Clin Cancer Res. 2006 Apr 1;12(7 Pt 1):2014-24. doi: 10.1158/1078-0432.CCR-05-1853. Clin Cancer Res. 2006. PMID: 16609010
-
Polymorphic tandem repeat sequences of the thymidylate synthase gene correlates with cellular-based sensitivity to fluoropyrimidine antitumor agents.Cancer Chemother Pharmacol. 2005 Nov;56(5):465-72. doi: 10.1007/s00280-005-1018-z. Epub 2005 May 26. Cancer Chemother Pharmacol. 2005. PMID: 15918040
-
Thymidylate Synthase expression as a predictor of clinical response to fluoropyrimidine-based chemotherapy in advanced colorectal cancer.Cancer Treat Rev. 2002 Feb;28(1):27-47. doi: 10.1053/ctrv.2002.0253. Cancer Treat Rev. 2002. PMID: 12027413 Review.
-
Posttranscriptional regulation of thymidylate synthase gene expression.J Cell Biochem. 1994 Apr;54(4):387-92. doi: 10.1002/jcb.240540405. J Cell Biochem. 1994. PMID: 8014187 Review.
Cited by
-
TFAP2E Methylation and Expression Status Does Not Predict Response to 5-FU-based Chemotherapy in Colorectal Cancer.Clin Cancer Res. 2018 Jun 15;24(12):2820-2827. doi: 10.1158/1078-0432.CCR-17-2940. Epub 2018 Mar 13. Clin Cancer Res. 2018. PMID: 29535127 Free PMC article.
-
Cyclin E and histone H3 levels are regulated by 5-fluorouracil in a DNA mismatch repair-dependent manner.Cancer Biol Ther. 2010 Dec 1;10(11):1147-56. doi: 10.4161/cbt.10.11.13447. Epub 2010 Dec 1. Cancer Biol Ther. 2010. PMID: 20930505 Free PMC article.
-
Novel candidate biomarkers of origin recognition complex 1, 5 and 6 for survival surveillance in patients with hepatocellular carcinoma.J Cancer. 2020 Jan 20;11(7):1869-1882. doi: 10.7150/jca.39163. eCollection 2020. J Cancer. 2020. PMID: 32194798 Free PMC article.
-
Integrative functional genomics analysis of sustained polyploidy phenotypes in breast cancer cells identifies an oncogenic profile for GINS2.Neoplasia. 2010 Nov;12(11):877-88. doi: 10.1593/neo.10548. Neoplasia. 2010. PMID: 21082043 Free PMC article.
-
Inhibition of BRCA2 and Thymidylate Synthase Creates Multidrug Sensitive Tumor Cells via the Induction of Combined "Complementary Lethality".Mol Ther Nucleic Acids. 2013 Mar 12;2(3):e78. doi: 10.1038/mtna.2013.7. Mol Ther Nucleic Acids. 2013. PMID: 23481354 Free PMC article.
References
-
- Navalgund LG, Rossana C, Muench AJ, Johnson LF. Cell cycle regulation of thymidylate synthetase gene expression in cultured mouse fibroblasts. J Biol Chem. 1980;255:7386–7390. - PubMed
-
- Danenberg PV. Thymidylate synthetase - a target enzyme in cancer chemotherapy. Biochim Biophys Acta. 1977;473:73–92. - PubMed
-
- Hardy LW, Finer-Moore JS, Montfort WR, Jones MO, Santi DV, Stroud RM. Atomic structure of thymidylate synthase: target for rational drug design. Science. 1987;235:448–455. - PubMed
Publication types
MeSH terms
Substances
LinkOut - more resources
Full Text Sources
Other Literature Sources
Research Materials
Miscellaneous
