. 2006 Apr 11;103(15):5741-5.
doi: 10.1073/pnas.0508511103. Epub 2006 Apr 3.

Overlapping hand-over-hand mechanism of single molecular motility of cytoplasmic dynein

Affiliations

Overlapping hand-over-hand mechanism of single molecular motility of cytoplasmic dynein

Shiori Toba et al. Proc Natl Acad Sci U S A. .

Abstract

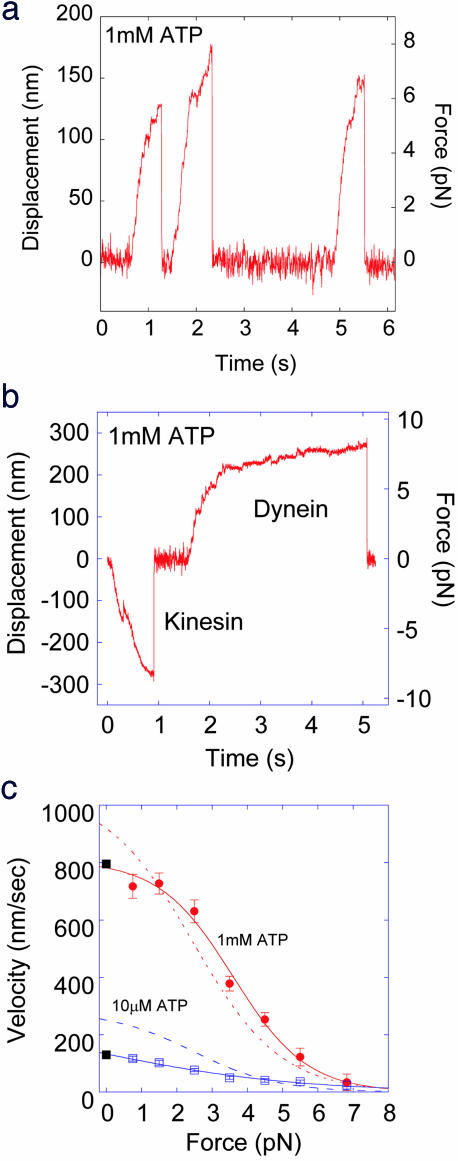
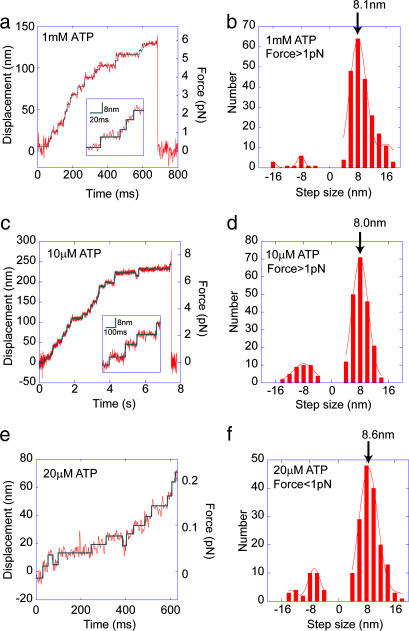
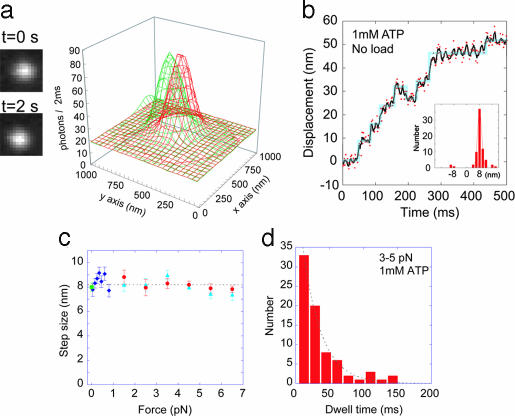
Structural differences between dynein and kinesin suggest a unique molecular mechanism of dynein motility. Measuring the mechanical properties of a single molecule of dynein is crucial for revealing the mechanisms underlying its movement. We measured the step size and force produced by single molecules of active cytoplasmic dynein by using an optical trap and fluorescence imaging with a high temporal resolution. The velocity of dynein movement, 800 nm/s, is consistent with that reported in cells. The maximum force of 7-8 pN was independent of the ATP concentration and similar to that of kinesin. Dynein exhibited forward and occasional backwards steps of approximately 8 nm, independent of load. It is suggested that the large dynein heads take 16-nm steps by using an overlapping hand-over-hand mechanism.


Conflict of interest statement

Conflict of interest statement: No conflicts declared.

Figures

Fig. 1.
Fig. 1.
Purification and force generation of single cytoplasmic dynein molecules. (a) SDS/PAGE of dynein purification. D lane, dynein purified by the anion-exchange column. D+M lane, dynein mixed with the microtubules. S and P indicate supernatant and pellet, respectively, after dynein mixed with the microtubules was centrifuged in the presence of 0.1 mM adenosine 5′-[β,γ-imido]triphosphate (AMP-PNP). After the pellet was suspended, it was centrifuged in the presence of 10 mM ATP. The supernatant was then used for the experiment. Numbers on the right indicate molecular mass in kDa. (b) The probability of the moving beads relative to the total beads was calculated. The molar ratio is the ratio of the bead concentration to the dynein concentration (10–20 nM) at the time of mixing. The probability was fitted to the curve, 1 − exp(−x/65), indicating that single molecules produced the force.
Fig. 2.
Fig. 2.
Force generation by single cytoplasmic dynein molecules. (a) Bead movement in the presence of 1 mM ATP at a trap stiffness of 45 fN/nm. Force reached 6–8 pN before the dynein molecule dissociated from the microtubule. (b) Dynein beads were mixed with kinesin at a ratio of 10:1 in the presence of 1 mM ATP at a trap stiffness of 30 fN/nm. (c) Force–velocity dependence at 1 mM (red circles) and 10 μM ATP (violet squares). Velocity was calculated from the displacement (20–30 nm) divided by the time taken to cover this distance. Each symbol is the average value of the velocities from 20–30 individual force traces. Velocities at zero force were measured by using an in vitro motility assay (closed squares). Dotted line indicates the force–velocity relation of bovine kinesin-1 from a previous study (9).
Fig. 3.
Fig. 3.
Step size of single dynein molecules. (a and c) Stepwise movement at high concentration (1 mM, a), and low concentration (10 μM, c) of ATP. (a and c Insets) Expanded traces of the stepwise movement. (e) Bead movement in 20 μM ATP at a trap stiffness of 3.0 fN/nm. (a, c, and e) Step sizes of >4 nm and dwell times of >5 ms (a) and >20 ms (c and e) were fitted to a rectangular curve (30) (blue line). (b, d, and f) Histograms of step sizes. (b) ATP concentration of 1 mM and forces >1 pN. (d) ATP concentration of 10 μM and forces >1 pN. (f) ATP concentration of 20 μM and forces <1 pN. The histograms ac were fitted to a Gaussian curve with the center at a multiple of the unit step size of 8.1, 8.0, and 8.6 nm, respectively.
Fig. 4.
Fig. 4.
Step sizes and dwell times. (a) Fluorescence images and profiles of the images of a quantum dot dynein interacting with a microtubule. The green-colored profile was taken at time 0 and the red profile was taken at t = 2 s. (b) Displacements of single dynein molecules at 2-ms intervals were determined by the intensity profiles fitted to 2D Gaussian curves (red dots). Three points were averaged to reduce noise (black line). Step sizes were automatically detected by using computer programming (blue line). (Inset) A histogram of the step size with a peak at 8.0 nm. (c) Step sizes were measured at high trap stiffness and ATP concentrations of 1 mM (circles) and 10 μM (triangles). Step sizes at low trap stiffness and 20 μM ATP (diamonds) and zero load (squares) were obtained. The average step size was 8.1 nm. (d) Dwell time between adjacent steps. The time was measured at 3- to 5-pN force in the presence of 1 mM ATP. The dwell time was fitted to a single exponential curve to obtain a time constant of 27 ms.

References

    1. Vale R. D. Cell. 2003;112:467–480. - PubMed
    1. Hirokawa N., Takemura R. Curr. Opin. Neurobiol. 2004;14:564–573. - PubMed
    1. Koonce M. P., Samso M. Trends Cell Biol. 2004;14:612–619. - PubMed
    1. Hirakawa E., Higuchi H., Toyoshima Y. Y. Proc. Natl. Acad. Sci. USA. 2000;97:2533–2537. - PMC - PubMed
    1. Mallik R., Carter B. C., Lex S. A., King S. J., Gross S. P. Nature. 2004;427:649–652. - PubMed

Publication types

LinkOut - more resources