

Effect of 6-month calorie restriction on biomarkers of longevity, metabolic adaptation, and oxidative stress in overweight individuals: a randomized controlled trial
- PMID: 16595757
- PMCID: PMC2692623
- DOI: 10.1001/jama.295.13.1539
Effect of 6-month calorie restriction on biomarkers of longevity, metabolic adaptation, and oxidative stress in overweight individuals: a randomized controlled trial
Erratum in
- JAMA. 2006 Jun 7;295(21):2482
Abstract
Context: Prolonged calorie restriction increases life span in rodents. Whether prolonged calorie restriction affects biomarkers of longevity or markers of oxidative stress, or reduces metabolic rate beyond that expected from reduced metabolic mass, has not been investigated in humans.
Objective: To examine the effects of 6 months of calorie restriction, with or without exercise, in overweight, nonobese (body mass index, 25 to <30) men and women.
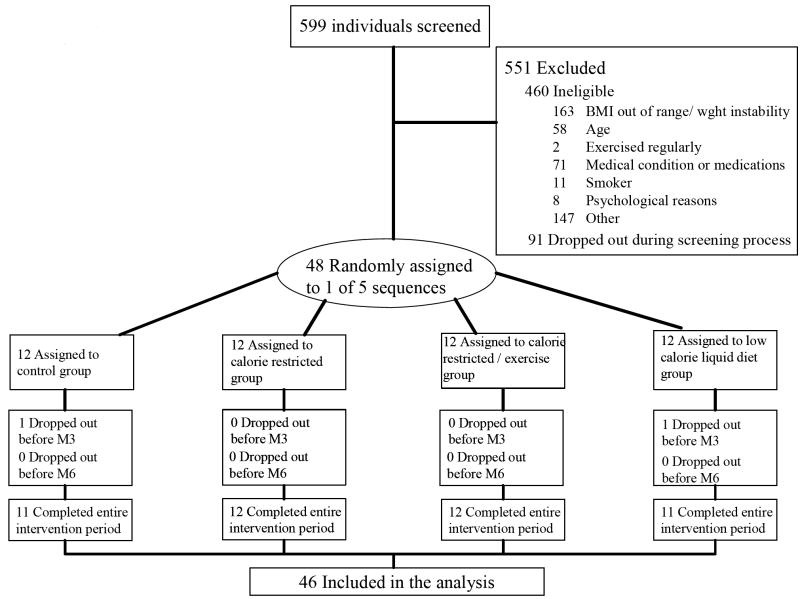
Design, setting, and participants: Randomized controlled trial of healthy, sedentary men and women (N = 48) conducted between March 2002 and August 2004 at a research center in Baton Rouge, La.
Intervention: Participants were randomized to 1 of 4 groups for 6 months: control (weight maintenance diet); calorie restriction (25% calorie restriction of baseline energy requirements); calorie restriction with exercise (12.5% calorie restriction plus 12.5% increase in energy expenditure by structured exercise); very low-calorie diet (890 kcal/d until 15% weight reduction, followed by a weight maintenance diet).
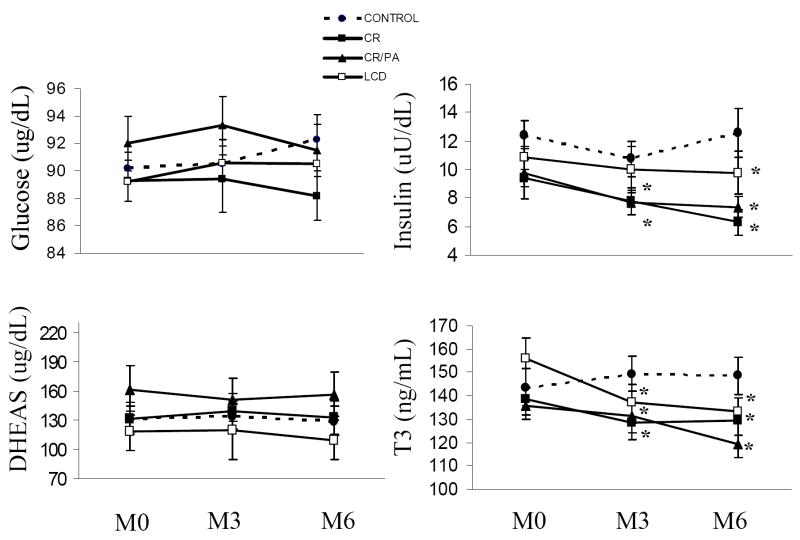
Main outcome measures: Body composition; dehydroepiandrosterone sulfate (DHEAS), glucose, and insulin levels; protein carbonyls; DNA damage; 24-hour energy expenditure; and core body temperature.
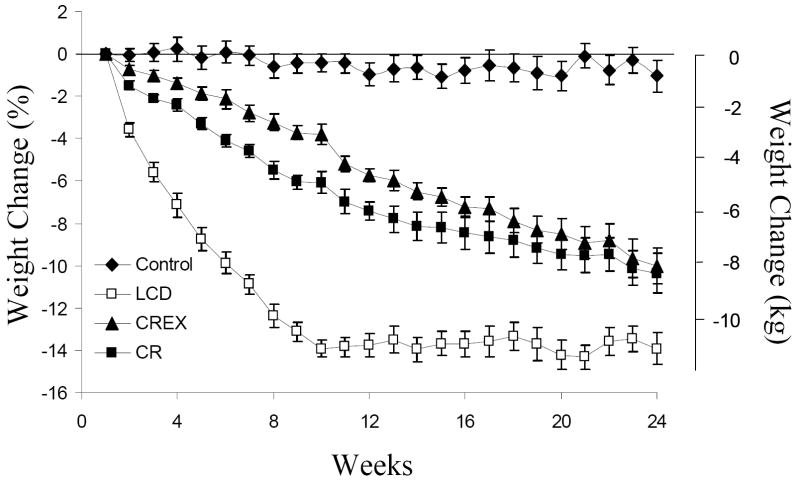
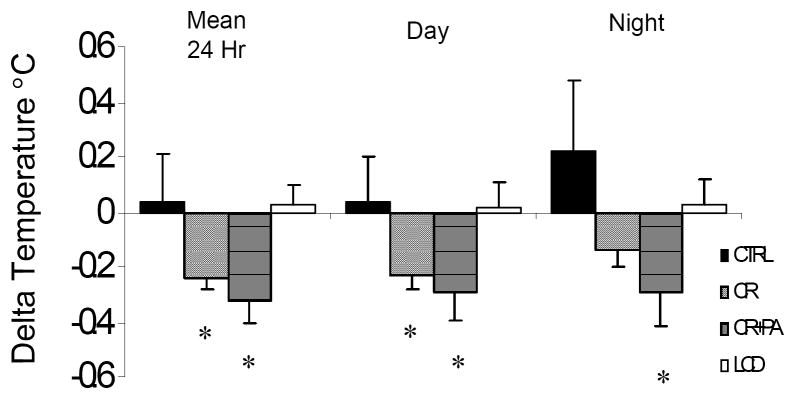
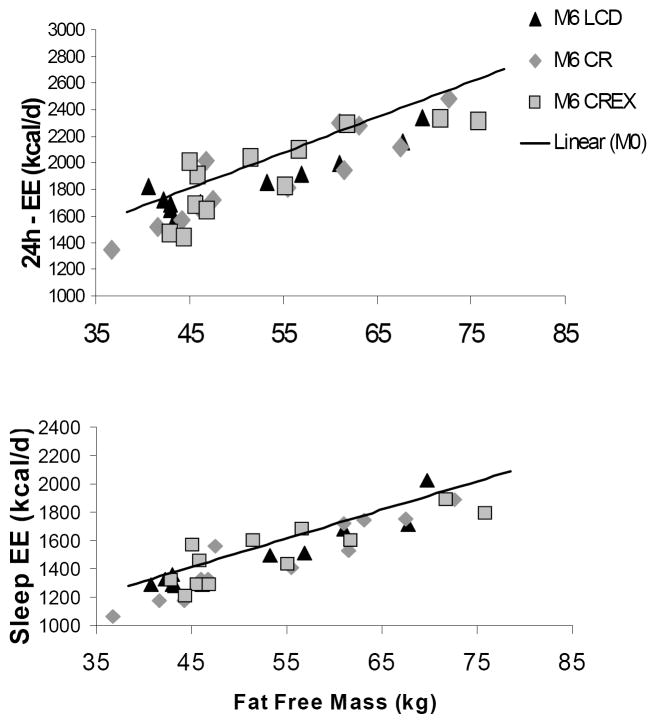
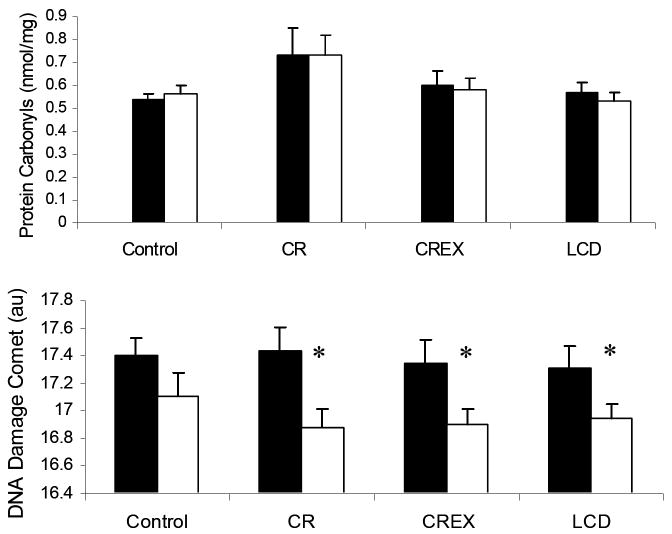
Results: Mean (SEM) weight change at 6 months in the 4 groups was as follows: controls, -1.0% (1.1%); calorie restriction, -10.4% (0.9%); calorie restriction with exercise, -10.0% (0.8%); and very low-calorie diet, -13.9% (0.7%). At 6 months, fasting insulin levels were significantly reduced from baseline in the intervention groups (all P<.01), whereas DHEAS and glucose levels were unchanged. Core body temperature was reduced in the calorie restriction and calorie restriction with exercise groups (both P<.05). After adjustment for changes in body composition, sedentary 24-hour energy expenditure was unchanged in controls, but decreased in the calorie restriction (-135 kcal/d [42 kcal/d]), calorie restriction with exercise (-117 kcal/d [52 kcal/d]), and very low-calorie diet (-125 kcal/d [35 kcal/d]) groups (all P<.008). These "metabolic adaptations" (~ 6% more than expected based on loss of metabolic mass) were statistically different from controls (P<.05). Protein carbonyl concentrations were not changed from baseline to month 6 in any group, whereas DNA damage was also reduced from baseline in all intervention groups (P <.005).
Conclusions: Our findings suggest that 2 biomarkers of longevity (fasting insulin level and body temperature) are decreased by prolonged calorie restriction in humans and support the theory that metabolic rate is reduced beyond the level expected from reduced metabolic body mass. Studies of longer duration are required to determine if calorie restriction attenuates the aging process in humans.
Trial registration: ClinicalTrials.gov Identifier: NCT00099151.
Figures
Comment in
-
Excessive adiposity, calorie restriction, and aging.JAMA. 2006 Apr 5;295(13):1577-8. doi: 10.1001/jama.295.13.1577. JAMA. 2006. PMID: 16595760 No abstract available.
References
-
- Weindruch R, Walford RL, Fligiel S, Guthrie D. The retardation of aging in mice by dietary restriction: longevity, cancer, immunity and lifetime energy intake. J Nutr. 1986 Apr;116(4):641–654. - PubMed
-
- Roth GS, Ingram DK, Black A, Lane MA. Effects of reduced energy intake on the biology of aging: the primate model. Eur J Clin Nutr. 2000 Jun;54(Suppl 3):S15–20. - PubMed
-
- Roth GS, Mattison JA, Ottinger MA, Chachich ME, Lane MA, Ingram DK. Aging in rhesus monkeys: relevance to human health interventions. Science. 2004 Sep 3;305(5689):1423–1426. - PubMed
-
- Heilbronn LK, Ravussin E. Calorie restriction and aging: review of the literature and implications for studies in humans. Am J Clin Nutr. 2003 Sep;78(3):361–369. - PubMed
-
- Ravussin E, Bogardus C. Relationship of genetics, age, and physical fitness to daily energy expenditure and fuel utilization. Am J Clin Nutr. 1989 May;49(5 Suppl):968–975. - PubMed
Publication types
MeSH terms
Substances
Associated data
Grants and funding
LinkOut - more resources
Full Text Sources
Other Literature Sources
Medical
