Comparative Study
. 2006 Dec;26(12):1538-50.
doi: 10.1038/sj.jcbfm.9600308. Epub 2006 Apr 5.

Mucosal tolerance to E-selectin and response to systemic inflammation

Affiliations
Comparative Study

Mucosal tolerance to E-selectin and response to systemic inflammation

Kachi Illoh et al. J Cereb Blood Flow Metab. 2006 Dec.

Abstract

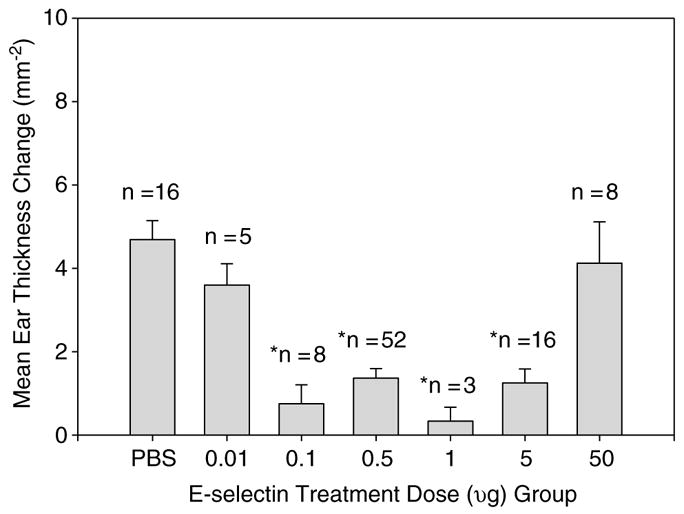
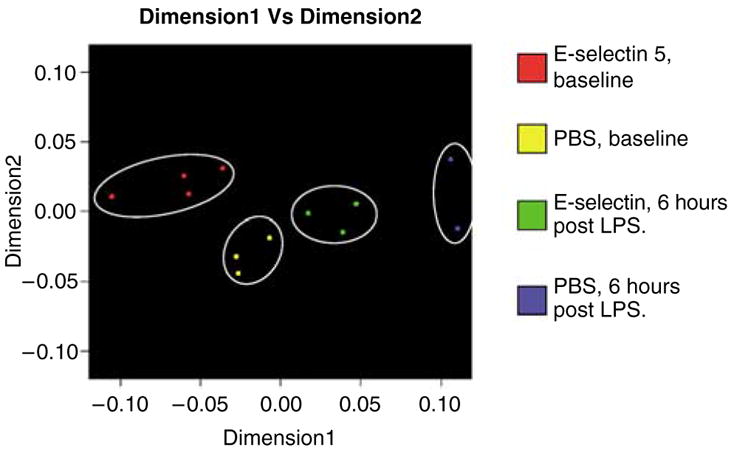
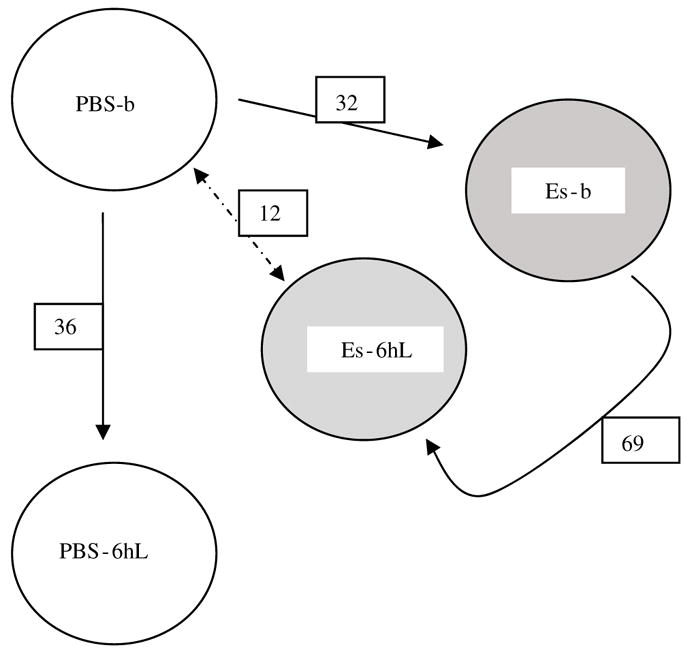
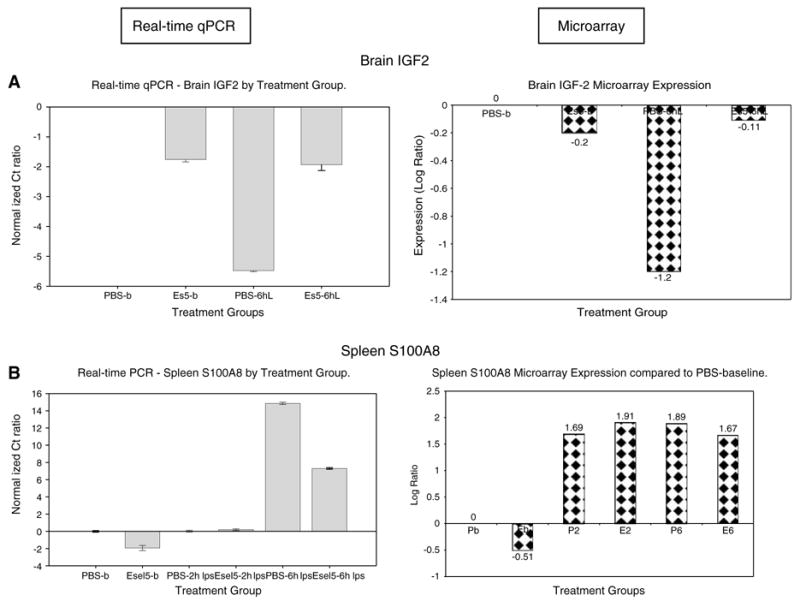
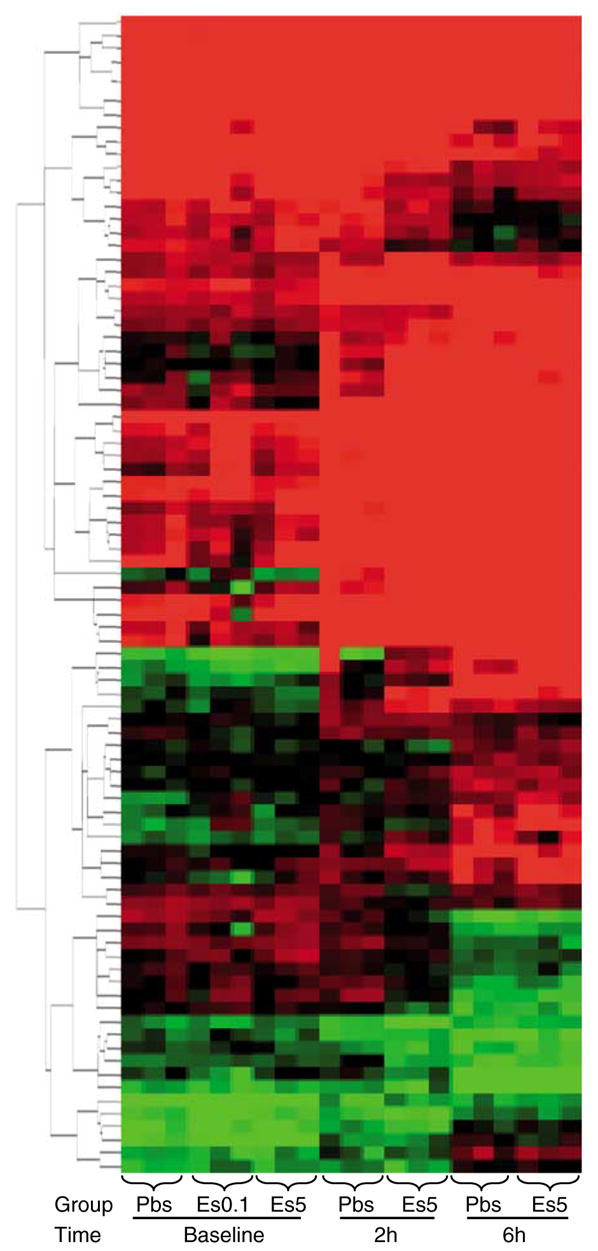
Mucosal tolerance to E-selectin has been shown to prevent stroke and reduce brain infarcts in experimental stroke models. However, the effective E-selectin dose range required to achieve mucosal tolerance and the precise mechanisms of neuroprotection remain unclear. We sought to examine the mechanisms of cytoprotection using gene expression profiling of tissues in the setting of mucosal tolerance and inflammatory challenge. Using spontaneously hypertensive rats (SHRs), we achieved immune tolerance with 0.1 to 5 microg E-selectin per nasal instillation and observed a dose-related anti-E-selectin immunoglobulin G antibody production. We also show the distinct patterns of gene expression changes in the brain and spleen with the different tolerizing doses and lipopolysaccharide (LPS) exposure. Prominent differences were seen with such genes as insulin-like growth factors in the brain and downregulation of those encoding the major histocompatibility complex class I molecules in the spleen. In all, mucosal tolerance to E-selectin and subsequent exposure to LPS resulted in significant tissue changes. These changes, while giving an insight to the underlying mechanisms, serve as possible targets for future studies to facilitate translation to human clinical trials.


Figures

Figure 1
Figure 1
Allocation of animals according to study group. Study animals (n = 141) received one schedule of intranasal tolerization with E-selectin or PBS. Delayed-type hypersensitivity studies were performed assess antibody generation (n = 21) or efficacy of E-selectin doses (n = 98). The other animals (n = 22) were treated on a second tolerization schedule and used for the microarray studies.
Figure 2
Figure 2
Pooled analysis of DTH suppression at 48 h by treatment group. Animals were treated with PBS or varying doses of E-selectin, then immunized and challenged with E-selectin to induce DTH. Suppression DTH was achieved by mucosal tolerance induced with E-selectin doses of 0.1 to 5 μg. Values are mean ± s.e.m. *Significantly different from PBS group at P < 0.01 by analysis of variance (ANOVA) analysis. DTH = delayed-type hypersensitivity. * Significantly different from PBS group with p <0.01
Figure 3
Figure 3
Multidimensional scaling analysis after analysis of variance (ANOVA) analysis of the brain at baseline and at 6 h post lipopolysaccharide (LPS) for phosphate-buffered saline (PBS) and E-selectin (5 μg) treatment groups. Differences in the aggregate expression of brain genes among the treatment groups were showed with genes shown to be differently expressed at P < 0.005 by ANOVA analysis.
Figure 4
Figure 4
Numbers of differentially expressed genes in the brain compared among study groups. The gene expression differences of the brain were compared between the PBS-b (phosphate-buffered saline group at baseline) group and other treatment groups to show the numerical transcript differences induced by E-selectin tolerization and lipopolysaccharide (LPS) challenge. PBS-b, PBS 6 h after LPS (PBS-6hL), E-selectin at baseline (ES-b), and E-selectin 6 h after LPS (Es-6hL).
Figure 5
Figure 5
Real-time quantitative polymerase chain reaction (qPCR) and microarray expression of selected genes in brain insulin-like growth factor (IGF)2 (A) and spleen S100A8 (B). The gene expression patterns of the selected genes were examined using real-time qPCR and compared with patterns from the microarray profiling. The expression for each treatment group is shown relative to the PBS-b group.
Figure 6
Figure 6
Spleen arrays of all groups (at baseline, at 2 h, and at 6 h post lipopolysaccharide (LPS)), hierarchical clustering by Euclidean distance of 88 differentially expressed genes at P < 0.0001. Differences in clustering of splenic genes by treatment group were showed after the one-way analysis of variance (ANOVA) analysis.

Similar articles

Cited by

References

    1. Becker KJ, McCarron RM, Ruetzler C, Laban O, Sternberg E, Flanders KC, Hallenbeck JM. Immunologic tolerance to MBP decreases stroke size after transient focal cerebral ischemia. Proc Natl Acad Sci USA. 1997;94:10873–8. - PMC - PubMed
    1. Beilharz EJ, Bassett NS, Sirimanne ES, Williams CE, Gluckman PD. Insulin-like growth factor II is induced during wound repair following hypoxic–ischemic injury in the developing rat brain. Brain Res Mol Brain Res. 1995;29:81–91. - PubMed
    1. Blumberg RS. Current concepts in mucosal immunity. II. One size fits all: nonclassical MHC molecules fulfill multiple roles in epithelial cell function. Am J Physiol. 1998;274:G227–31. - PubMed
    1. Bogumil T, Rieckmann P, Kubuschok B, Felgenhauer K, Bruck W. Serum levels of macrophage-derived protein MRP-8/14 are elevated in active multiple sclerosis. Neurosci Lett. 1998;247:195–7. - PubMed
    1. Butovsky O, Talpalar AE, Ben-Yaakov K, Schwartz M. Activation of microglia by aggregated beta-amyloid or lipopolysaccharide impairs MHC-II expression and renders them cytotoxic whereas IFN-gamma and IL-4 render them protective. Mol Cell Neurosci. 2005;29:381–93. - PubMed

Publication types

MeSH terms

LinkOut - more resources