Review
. 2006 Apr;17(4):288-97.
doi: 10.1007/s00335-005-0145-5. Epub 2006 Apr 4.

Data and animal management software for large-scale phenotype screening

Affiliations
Review

Data and animal management software for large-scale phenotype screening

Keith A Ching et al. Mamm Genome. 2006 Apr.

Abstract

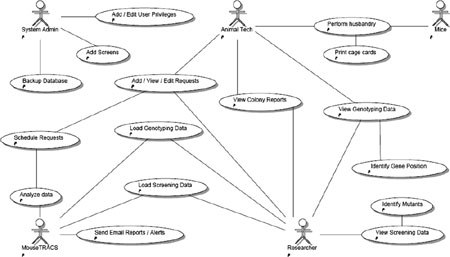
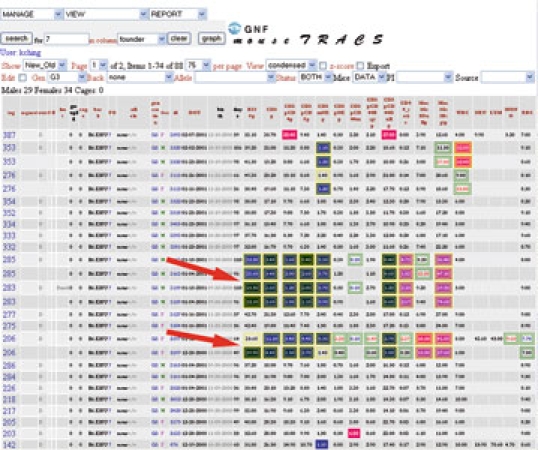
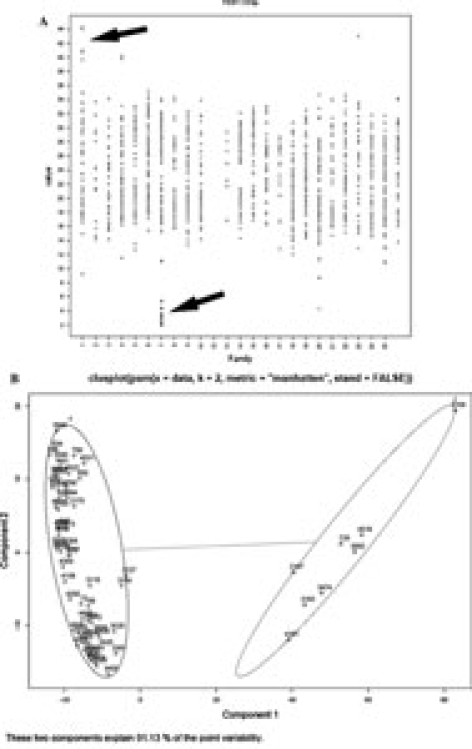
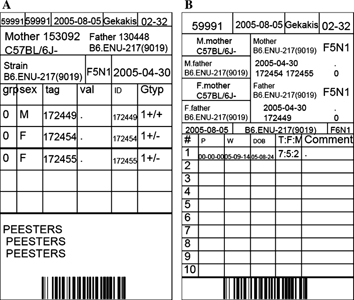
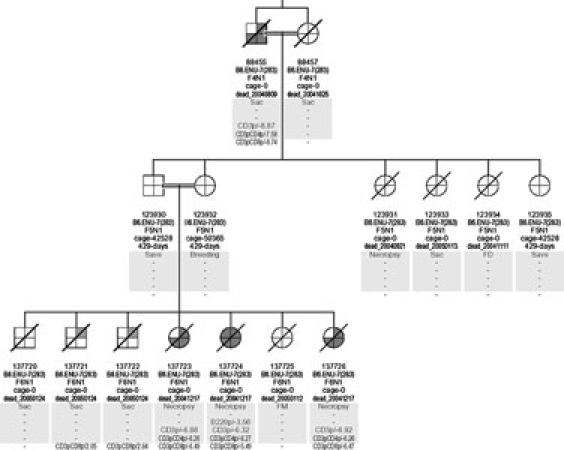
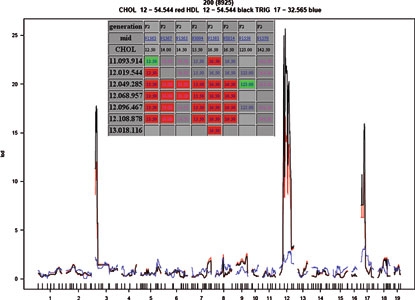
The mouse N-ethyl-N-nitrosourea (ENU) mutagenesis program at the Genomics Institute of the Novartis Research Foundation (GNF) uses MouseTRACS to analyze phenotype screens and manage animal husbandry. MouseTRACS is a Web-based laboratory informatics system that electronically records and organizes mouse colony operations, prints cage cards, tracks inventory, manages requests, and reports Institutional Animal Care and Use Committee (IACUC) protocol usage. For efficient phenotype screening, MouseTRACS identifies mutants, visualizes data, and maps mutations. It displays and integrates phenotype and genotype data using likelihood odds ratio (LOD) plots of genetic linkage between genotype and phenotype. More detailed mapping intervals show individual single nucleotide polymorphism (SNP) markers in the context of phenotype. In addition, dynamically generated pedigree diagrams and inventory reports linked to screening results summarize the inheritance pattern and the degree of penetrance. MouseTRACS displays screening data in tables and uses standard charts such as box plots, histograms, scatter plots, and customized charts looking at clustered mice or cross pedigree comparisons. In summary, MouseTRACS enables the efficient screening, analysis, and management of thousands of animals to find mutant mice and identify novel gene functions. MouseTRACS is available under an open source license at http://www.mousetracs.sourceforge.net.


Figures

Fig. 1
Fig. 1
A use case diagram outlines the main functionality and value of MouseTRACS. Users (stick figures) interact with the system to accomplish specific tasks (ovals). Animal technicians perform animal husbandry and also view animal management requests made by researchers. Researchers load and view the screening data. The MouseTRACS system runs automated analysis scripts that flag data and make animal management requests. The system administrator maintains the database by backing up data, adding users, and adding new phenotyping screens.
Fig. 2
Fig. 2
Identification of founder No. 7. This sample screenshot of the data viewer shows G3 mice from founder line No. 7 that were identified as low B-cell and low T-cell mutants. Mice are arranged in rows with summary information such as sex, birth date, generation, background, allele, and current requests. Screening data are shown in columns with the test name, date performed, and test value. To highlight outliers, flagged data is colored according to z-score where highs are a shade of red and lows a hue of blue. Because of inherent noise in the screening data, mice that flag for a test are autoscheduled for a confirming retest. Confirming test results are boxed with a yellow outline and nonconfirming tests are boxed in green. Tests are organized into views of logically related assays such as flow cytometry and hematology. Data can be searched by founder, background, allele, generation, date of test, mouse ID, investigator, and various combinations of the above.
Fig. 3
Fig. 3
(A) Interpedigree graph compares test values between pedigrees. Mutants from founder family No. 7 can be seen as a cluster of low CD3 values relative to test results from other founder lines. Founder family No. 1 mutants with high values can also be seen. Test values for CD3 are plotted on the y axis while founder line is plotted on the x axis. (B) Intrapedigree clustering compares test values within a pedigree. Test results for all tests in the flow cytometry assay for G3 mice from founder line No. 7 were clustered using the PAM (Kaufman and Rousseeuw 1990) clustering method. The top two principal components are used to plot the mouse ID on the x and y axes. Mice are separated into k clusters, two in this case. Mutants are represented by the right ellipse while unaffected mice reside in the left ellipse. The line connecting the center of the ellipses represents the distance between clusters. Overlapping ellipses would indicate poor cluster separation due to no mutants or more than two populations of mice.
Fig. 4
Fig. 4
(A) Sample of a printed weaning card shows the cage number, parental cage, cage creation date, protocol, protocol number, parental information, and information about the mice in the cage. (B) A printed breeding card shows parental information for the breeding mice as well as litter information.
Fig. 5
Fig. 5
Pedigree from a founder No. 7 mating with overlaid data. Double lines between parents denote a sibling intercross. Slashes indicate deceased animals. Light and dark shaded sections show traits that are higher and lower than usual, respectively. Test names and z-scores are shown for flagged test values.
Fig. 6
Fig. 6
Automated QTL mapping. The inset shows a Web-generated SNP interval map that displays test results in the context of genetic background. The genomic location is listed in the first column as chromosome.megabases.kilobases. Results for males are blue while females are pink. Green cells indicate the mapping strain. Red cells show the mutant strain while gray cells show heterozygous SNP calls. Using R and the qtl package, the generated LOD plot shows genomic locations that are correlated with measured phenotypes. An initial genome scan of eight mice for two affected phenotypes (red and black) show four major peaks. One unaffected phenotype of triglycerides (blue) is used as a negative control. Peaks that are high in cholesterol (red) and HDL (black) but not triglycerides are potential loci for genes with causative mutations.

References

    1. Baker E, Galloway L, Jackson B, Schmoyer D, Snoddy J. MuTrack: a genome analysis system for large-scale mutagenesis in the mouse. BMC Bioinformatics. 2004;5:11. doi: 10.1186/1471-2105-5-11. - DOI - PMC - PubMed
    1. Broman KW, Wu H, Sen S, Churchill GA. R/qtl: QTL mapping in experimental crosses. Bioinformatics. 2003;19:889–890. doi: 10.1093/bioinformatics/btg112. - DOI - PubMed
    1. Kane LP, Lin J, Weiss A. Signal transduction by the TCR for antigen. Curr Opin Immunol. 2000;12(3):242–249. doi: 10.1016/S0952-7915(00)00083-2. - DOI - PubMed
    1. Kaufman L, Rousseeuw PJ. Finding Groups in Data: An Introduction to Cluster Analysis. New York: Wiley; 1990.
    1. Lloyd DJ, Hall FW, Tarantino LM, Gekakis N. Diabetes insipidus in mice with a mutation in aquaporin-2. PLoS Genet. 2005;1(2):e20. doi: 10.1371/journal.pgen.0010020. - DOI - PMC - PubMed