. 2005 Nov;84(3):555-79.
doi: 10.1901/jeab.2005.110-04.

Dynamic response-by-response models of matching behavior in rhesus monkeys

Affiliations

Dynamic response-by-response models of matching behavior in rhesus monkeys

Brian Lau et al. J Exp Anal Behav. 2005 Nov.

Abstract

We studied the choice behavior of 2 monkeys in a discrete-trial task with reinforcement contingencies similar to those Herrnstein (1961) used when he described the matching law. In each session, the monkeys experienced blocks of discrete trials at different relative-reinforcer frequencies or magnitudes with unsignalled transitions between the blocks. Steady-state data following adjustment to each transition were well characterized by the generalized matching law; response ratios undermatched reinforcer frequency ratios but matched reinforcer magnitude ratios. We modelled response-by-response behavior with linear models that used past reinforcers as well as past choices to predict the monkeys' choices on each trial. We found that more recently obtained reinforcers more strongly influenced choice behavior. Perhaps surprisingly, we also found that the monkeys' actions were influenced by the pattern of their own past choices. It was necessary to incorporate both past reinforcers and past choices in order to accurately capture steady-state behavior as well as the fluctuations during block transitions and the response-by-response patterns of behavior. Our results suggest that simple reinforcement learning models must account for the effects of past choices to accurately characterize behavior in this task, and that models with these properties provide a conceptual tool for studying how both past reinforcers and past choices are integrated by the neural systems that generate behavior.


Figures

Figure 1
Figure 1. Timeline and spatial arrangement of the two-alternative choice task.
Figure 2
Figure 2. Example choice data aligned on the trial (dashed line) that a transition between ratios occurred.
The upper panels are data from conditions (Table 1) where reinforcer frequency was manipulated, and the lower panels are data from conditions where reinforcer magnitudes were manipulated. The data were compiled with respect to the alternative that was richer following the transition, and averaged separately for the two possible programmed posttransition ratios (pretransition ratios were on average ∼1:4 for the top panels, and ∼1:2 for the bottom panels). The data were smoothed using a five-point moving average.
Figure 3
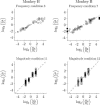
Figure 3. Log choice ratios (right over left) from individual conditions (see Table 1 for ratios used in each condition) as a function of obtained log reinforcer frequency ratios (upper panels) or log reinforcer magnitude ratios (lower panels).
Each point was obtained by averaging the number of choices and reinforcers from the last 65 trials of a block. The lines represent least-squares fits of the generalized matching law, the coefficients of which are listed in Table 2. The solid symbols plotted at the extremes of the abscissa (for Monkey B) represent blocks where no reinforcers were obtained from one of the alternatives. For the magnitude conditions, the effect due to reinforcer frequency has been subtracted from the log choice ratios.
Figure 4
Figure 4. Log choice ratios (right over left) as a function of obtained log reinforcer frequency ratios and log reinforcer magnitude ratios.
Each point was obtained by averaging choices and reinforcers from the last 65 trials of a block. All such data from both the frequency (open squares) and magnitude (filled circles) experiments are plotted. The planes through the data are fits of the generalized matching law to the entire data set for each monkey.
Figure 5
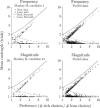
Figure 5. Mean runlength as a function of preference.
Each point represents the mean runlength in the last 65 trials of each block, plotted separately for choices of the rich (circles) and lean alternatives (×s). The data are plotted on log-log coordinates, and the points are jittered slightly along the abscissa to reveal points that otherwise would have stacked on top of each other. The lines represent mean runlengths predicted by a Bernoulli process that allocates choice independently from trial-to-trial, as in a series of independent weighted coin flips. The left panels show examples from single conditions for each monkey. The right panels show runlengths for all the data combined; for clarity, the data points for the conditions used in the left panels are not included in the pooled data.
Figure 6
Figure 6. Coefficients for the fitted dynamic linear model as a function of the number of trials in the past relative to the current trial.
The coefficients for past reinforcers, past choices, and biases are plotted in the upper, middle, and lower panels, respectively. The vertical ticks in the upper panels represent the largest 95% confidence intervals for the past reinforcers. Confidence intervals are not plotted for the other coefficients, as they were smaller than the symbols.
Figure 7
Figure 7. Predicted and observed choice data for a single session of data from Monkey H (Condition 6).
The dashed vertical lines mark the unsignalled block transitions. The data were smoothed with a nine-point moving average.
Figure 8
Figure 8. Predicted and observed choice data aligned on the trial that a transition between ratios occurred.
The upper panels are data from conditions where reinforcer frequency was manipulated, and the lower panels are data from conditions where reinforcer magnitudes were manipulated. The left panels show examples from single conditions for each monkey; the right panels show averages across the entire data set. These data were compiled with respect to the two possible posttransition ratios for each condition (see Figure 2 for details). The data were smoothed using a five-point moving average.
Figure 9
Figure 9. Autocorrelation functions of model residuals.
The thick black line and the dashed line are the autocorrelation functions of the residuals from the best-fitting models (see Table 3) for the probability and magnitude conditions, respectively. The top panels show examples from single conditions for each monkey; the bottom panels show averages across the entire data set. The thin black line in the lower panels is the autocorrelation function of the residuals from a model that does not account for the effects of past choices (only shown for magnitude conditions). The gray horizontal bands give approximate 95% confidence intervals for an independent stochastic process.
Figure 10
Figure 10. Two-stage description of choice.
The first stage involves valuation of each alternative based on past reinforcer and choices, and possibly other factors like satiety. The second stage generates the choice by comparing the value of each alternative and selecting one using a decision rule.
Figure 11
Figure 11. Comparison of coefficients for past reinforcers with exponential and hyperbolic weightings predicted by theoretical choice models.
Each of the four curves has been normalized to unit area. The time constant of the exponential is three trials, and the hyperbolic function is given by the reciprocal of the trial number.

Similar articles

Cited by

References

    1. Akaike H. A new look at the statistical model identification. IEEE Transaction on Automatic Control. 1974;19:716–723.
    1. Anderson K.G, Velkey A.J, Woolverton W.L. The generalized matching law as a predictor of choice between cocaine and food in rhesus monkeys. Psychopharmacology. 2002;163:319–326. - PubMed
    1. Bailey J, Mazur J. Choice behavior in transition: Development of preference for the higher probability of reinforcement. Journal of the Experimental Analysis of Behavior. 1990;53:409–422. - PMC - PubMed
    1. Barraclough D.J, Conroy M.L, Lee D. Prefrontal cortex and decision making in a mixed-strategy game. Nature Neuroscience. 2004;7:404–410. - PubMed
    1. Baum W. On two types of deviation from the matching law: Bias and undermatching. Journal of the Experimental Analysis of Behavior. 1974;22:231–242. - PMC - PubMed

Publication types

LinkOut - more resources