

The nob2 mouse, a null mutation in Cacna1f: anatomical and functional abnormalities in the outer retina and their consequences on ganglion cell visual responses
- PMID: 16597347
- PMCID: PMC2831086
- DOI: 10.1017/S095252380623102X
The nob2 mouse, a null mutation in Cacna1f: anatomical and functional abnormalities in the outer retina and their consequences on ganglion cell visual responses
Abstract
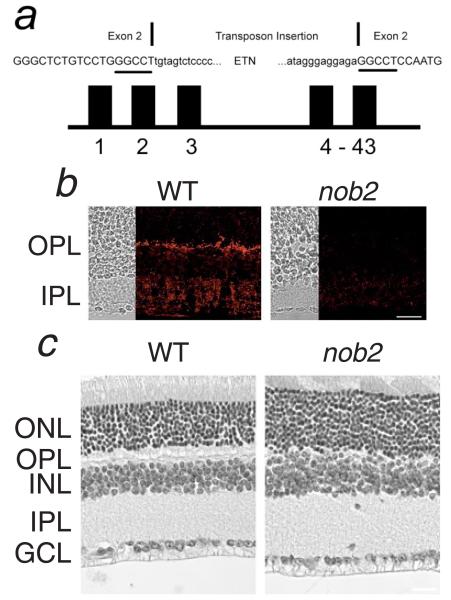
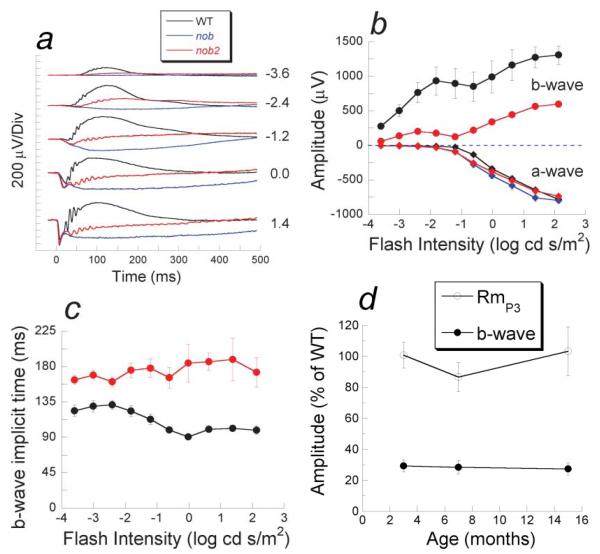
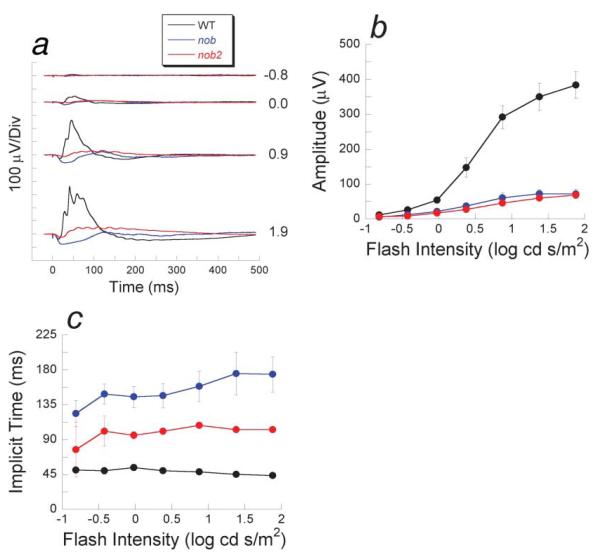
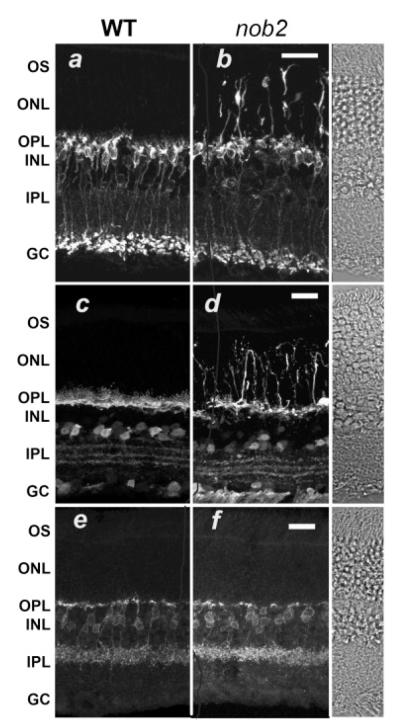
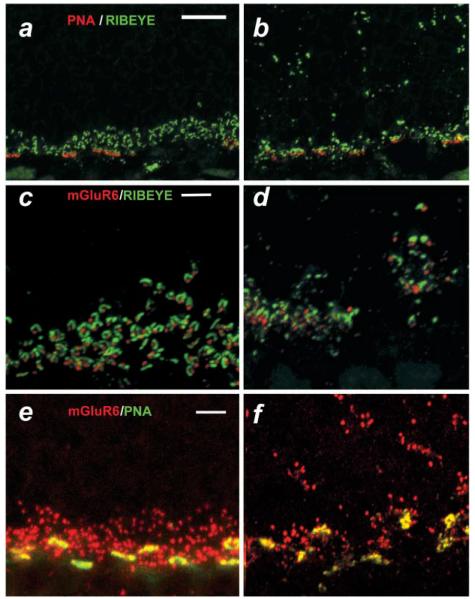
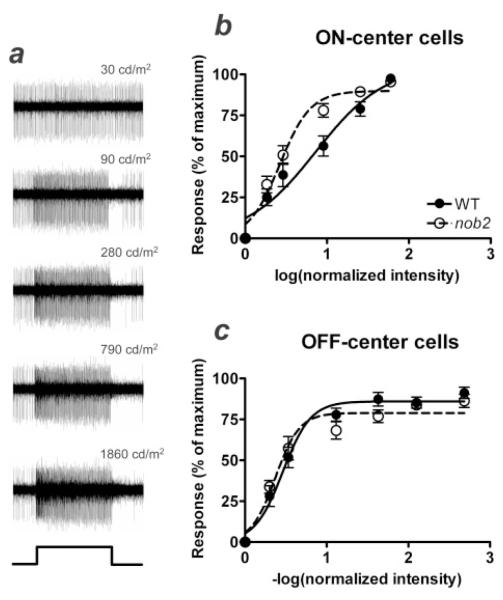
Glutamate release from photoreceptor terminals is controlled by voltage-dependent calcium channels (VDCCs). In humans, mutations in the Cacna1f gene, encoding the alpha1F subunit of VDCCs, underlie the incomplete form of X-linked congenital stationary night blindness (CSNB2). These mutations impair synaptic transmission from rod and cone photoreceptors to bipolar cells. Here, we report anatomical and functional characterizations of the retina in the nob2 (no b-wave 2) mouse, a naturally occurring mutant caused by a null mutation in Cacna1f. Not surprisingly, the b-waves of both the light- and dark-adapted electroretinogram are abnormal in nob2 mice. The outer plexiform layer (OPL) is disorganized, with extension of ectopic neurites through the outer nuclear layer that originate from rod bipolar and horizontal cells, but not from hyperpolarizing bipolar cells. These ectopic neurites continue to express mGluR6, which is frequently associated with profiles that label with the presynaptic marker Ribeye, indicating potential points of ectopic synapse formation. However, the morphology of the presynaptic Ribeye-positive profiles is abnormal. While cone pedicles are present their morphology also appears compromised. Characterizations of visual responses in retinal ganglion cells in vivo, under photopic conditions, demonstrate that ON-center cells have a reduced dynamic range, although their basic center-surround organization is retained; no alteration in the responses of OFF-center cells was evident. These results indicate that nob2 mice are a valuable model in which to explore the pathophysiological mechanisms associated with Cacna1f mutations causing CSNB2, and the subsequent effects on visual information processing. Further, the nob2 mouse represents a model system in which to define the signals that guide synapse formation and/or maintenance in the OPL.
Figures
References
-
- Ball SL, McEnery M, Gregg RG. Voltage gated calcium channel subunit composition and distribution in the retina. Investigative Ophthalmology and Visual Science. 2004;45 E-abstract 5423.
-
- Ball SL, Pardue MT, McCall MA, Gregg RG, Peachey NS. Immunohistochemical analysis of the outer plexiform layer in the nob mouse shows no abnormalities. Visual Neuroscience. 2003;20:267–272. - PubMed
-
- Ball SL, Powers PA, Shin HS, Morgans CW, Peachey NS, Gregg RG. Role of the β2 subunit of voltage-dependent calcium channels in the retinal outer plexiform layer. Investigative Ophthalmology and Visual Science. 2002;43:1595–1603. - PubMed
-
- Barthel L, Raymond PA. Improved method for obtaining 3 μm cryosections for immunocytochemistry. Journal of Histochemistry and Cytochemistry. 1990;38:1383–1388. - PubMed
-
- Baumann L, Gerstner A, Zong X, Biel M, Wahl-Schott C. Functional characterization of the L-type Ca2+ channel Cav1.4 from mouse retina. Investigative Ophthalmology and Visual Science. 2004;45:708–713. - PubMed
Publication types
MeSH terms
Substances
Grants and funding
- R01EY14465/EY/NEI NIH HHS/United States
- R01 EY004067/EY/NEI NIH HHS/United States
- R01 EY012354/EY/NEI NIH HHS/United States
- R01EY012354/EY/NEI NIH HHS/United States
- R01EY014700/EY/NEI NIH HHS/United States
- R01 EY015573/EY/NEI NIH HHS/United States
- R01 EY007758/EY/NEI NIH HHS/United States
- R01EY014701/EY/NEI NIH HHS/United States
- RR001183/RR/NCRR NIH HHS/United States
- R24 EY015638/EY/NEI NIH HHS/United States
- R01 EY014701/EY/NEI NIH HHS/United States
- R01 EY014700/EY/NEI NIH HHS/United States
- R24EY15638/EY/NEI NIH HHS/United States
- R01 EY014465/EY/NEI NIH HHS/United States
- R01EY007758/EY/NEI NIH HHS/United States
- R01EY04067/EY/NEI NIH HHS/United States
- P40 RR001183/RR/NCRR NIH HHS/United States
LinkOut - more resources
Full Text Sources
Other Literature Sources
Molecular Biology Databases
Miscellaneous
