Randomized Controlled Trial
. 2006 Apr 5;26(14):3634-41.
doi: 10.1523/JNEUROSCI.4382-05.2006.

No functional magnetic resonance imaging evidence for brightness and color filling-in in early human visual cortex

Affiliations
Randomized Controlled Trial

No functional magnetic resonance imaging evidence for brightness and color filling-in in early human visual cortex

Frans W Cornelissen et al. J Neurosci. .

Abstract

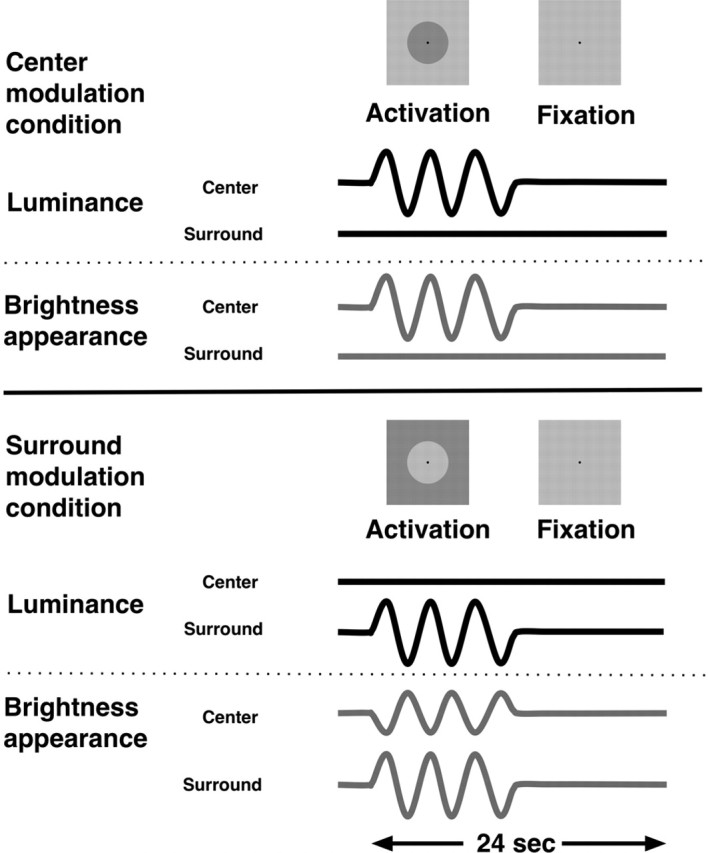
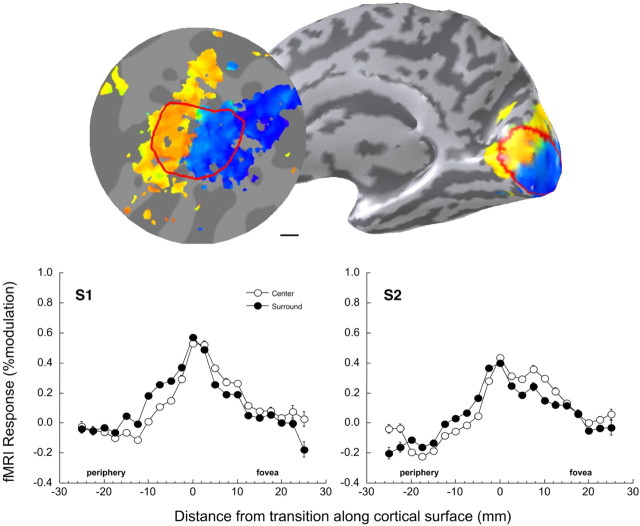
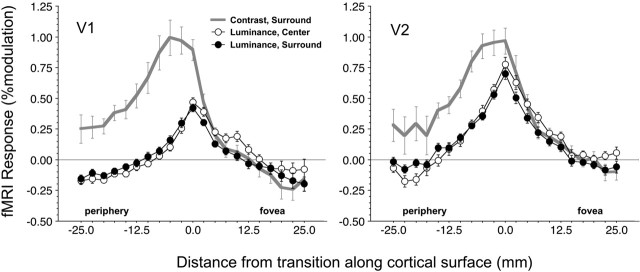
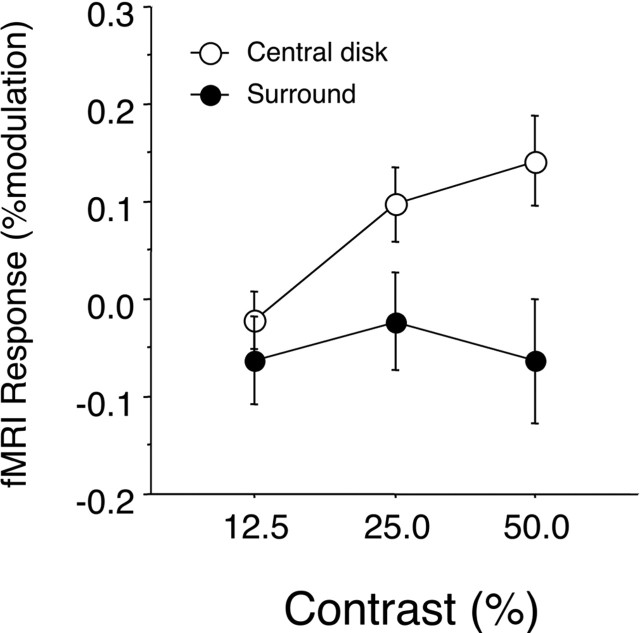
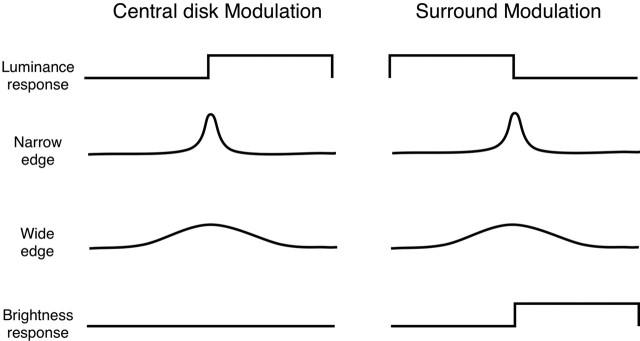
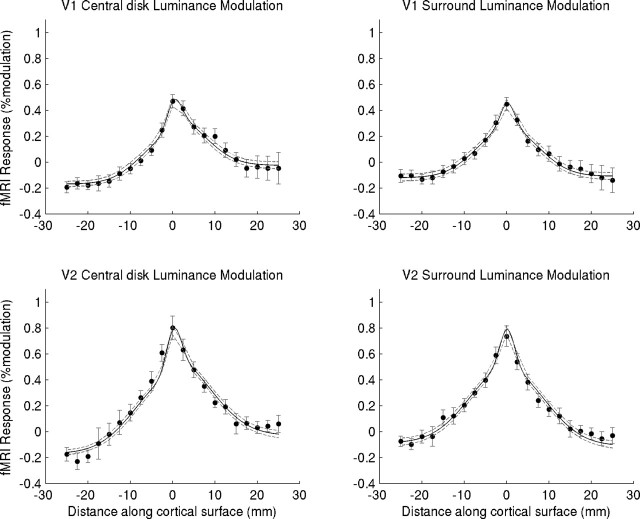
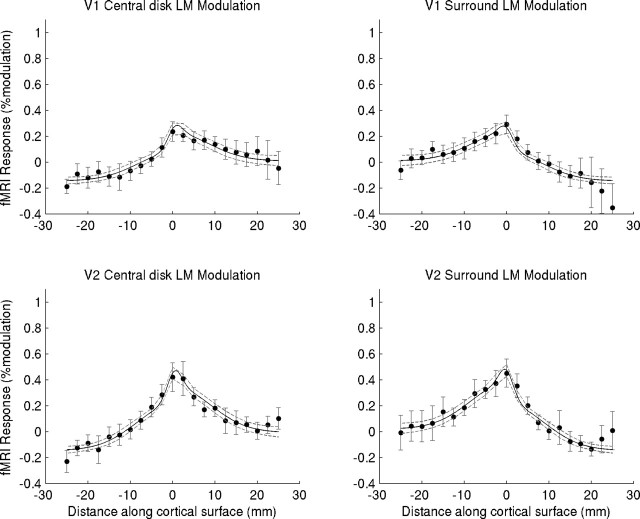
The brightness and color of a surface depends on its contrast with nearby surfaces. For example, a gray surface can appear very light when surrounded by a black surface or dark when surrounded by a white surface. Some theories suggest that perceived surface brightness and color is represented explicitly by neural signals in cortical visual field maps; these neural signals are not initiated by the stimulus itself but rather by the contrast signals at the borders. Here, we use functional magnetic resonance imaging (fMRI) to search for such neural "filling-in" signals. Although we find the usual strong relationship between local contrast and fMRI response, when perceived brightness or color changes are induced by modulating a surrounding field, rather than the surface itself, we find there is no corresponding local modulation in primary visual cortex or other nearby retinotopic maps. Moreover, when we model the obtained fMRI responses, we find strong evidence for contributions of both local and long-range edge responses. We argue that such extended edge responses may be caused by neurons previously identified in neurophysiological studies as being brightness responsive, a characterization that may therefore need to be revised. We conclude that the visual field maps of human V1 and V2 do not contain filled-in, topographical representations of surface brightness and color.


Figures

Figure 1.
Figure 1.
Representation of the experimental paradigm. Subjects view stimuli in which either the luminance of a central disk is temporally modulated around mean luminance level (top) or the field surrounding the disk is modulated (bottom). In both cases, subjects perceive brightness modulations that accompany the luminance modulations, but only in the surround-modulation condition can we dissociate brightness changes from local-luminance changes. In each experimental run, we alternated one experimental condition (either central disk or surround modulation, at 1 particular contrast level) with the fixation condition. Six cycles of activation and fixation were presented during one run.
Figure 2.
Figure 2.
Top right, Inflated view of one individual's right hemisphere (S1) showing the positions of responses to the foveal (blue) and peripheral (yellow) checkerboard localizers used to define the regions of interest. Red indicates outline of V1 as determined using retinotopic mapping. Top left, Flattened section of occipital cortex of the same hemisphere. The transition from the foveal (blue) to peripheral (yellow) activation was determined in such flat maps. Bottom, Individual V1 responses for two subjects during central disk (open circles) and surround (filled circles) luminance modulation, as a function of cortical distance from the representation of the transition between center and surround (at distance 0). Negative distances are in the direction of the periphery of the visual field, and positive distances are in the direction of the fovea. Results are averaged over hemisphere and contrast. Error bars (where visible) show SEM (over voxels in a bin). As a result of likely dependence of responses between neighboring voxels, error bars should only be taken as an approximate indication of the true error.
Figure 3.
Figure 3.
Mean responses in V1 and V2 of five subjects (10 hemispheres) during central disk (open circles) and surround (filled circles) modulation as a function of cortical distance from the representation of the transition between center and surround (at distance 0) are shown. Negative distances are in the direction of the periphery of the visual field, and positive distances are in the direction of the fovea. Also plotted is response to a surround contrast (checkerboard) stimulus (gray curve). Results are averaged over hemisphere and contrast (in the case of the 2 brightness-inducing stimuli). Bars show SEM over hemispheres.
Figure 4.
Figure 4.
Average fMRI signal change in six subjects (12 hemispheres) as a function of luminance modulation in the central 1.5° FC ROI. The open and filled symbols show results for central disk and surround modulations, respectively. Bars show SEM (over hemispheres).
Figure 5.
Figure 5.
Model components used to fit the data shown in Figures 6 and 7. The putative neural signal underlying the BOLD response was modeled as a linear combination of (1) a local luminance-brightness response (only present in the section of cortex representing a physically changing part of the stimulus), (2) narrow and wide edge responses, and (3) a surround-induced (brightness) response in the center region (note that during central disk modulation, it is impossible to separate out luminance and brightness responses). The combined neural signal was convolved with a Gaussian to impose the low-pass characteristics of the BOLD response (FWHM, 3.5 mm) ((Engel et al., 1997).
Figure 6.
Figure 6.
Modeling fMRI responses in V1 and V2 during central disk and surround luminance modulation. Results are shown as a function of cortical distance from the transition between center and surround (at distance 0). Negative distances are in the direction of the periphery of the visual field, and positive distances are in the direction of the fovea. Filled symbols are data points (averages of 6 subjects, 2 hemispheres each) with 95% confidence intervals, indicated by gray error bars (data averaged over contrast, subject, and hemisphere). The black line is model fit with 95% confidence intervals indicated by dashed gray lines. Model components are described in Figure 5. See supplemental material (available at www.jneurosci.org) for detailed model description, fitting procedure, and model selection.
Figure 7.
Figure 7.
Modeling fMRI responses in V1 and V2 during central disk and surround isoluminant color modulation (LM direction in color space). Results are shown as a function of cortical distance from the transition between center and surround (at distance 0). Negative distances are in the direction of the periphery of the visual field, and positive distances are in the direction of the fovea. The filled symbols are data points (averages of 4 subjects, 2 hemispheres each), with gray error bars indicating the 95% confidence intervals (data averaged over contrast, subject, and hemisphere). The black line is model fit with 95% confidence intervals, indicated by dashed gray lines. Model components are described in Figure 5. In contrast to the luminance modulation results shown in Figure 6, for color modulation, adding an induced component did not improve the model. See supplemental material (available at www.jneurosci.org) for detailed model description, fitting procedure, and model selection.

References

    1. Arrington KF (1994). The temporal dynamics of brightness filling-in. Vision Res 34:3371–3387. - PubMed
    1. Bindman D, Chubb C (2004a). Brightness assimilation in bullseye displays. Vision Res 44:309–319. - PubMed
    1. Bindman D, Chubb C (2004b). Mechanisms of contrast induction in heterogeneous displays. Vision Res 44:1601–1613. - PubMed
    1. Blakeslee B, McCourt ME (1999). A multiscale spatial filtering account of the White effect, simultaneous brightness contrast and grating induction. Vision Res 39:4361–4377. - PubMed
    1. Blakeslee B, McCourt ME (2004). A unified theory of brightness contrast and assimilation incorporating oriented multiscale spatial filtering and contrast normalization. Vision Res 44:2483–2503. - PubMed

Publication types