. 2006 Apr 5;26(14):3646-55.
doi: 10.1523/JNEUROSCI.4605-05.2006.

Correlation-induced synchronization of oscillations in olfactory bulb neurons

Affiliations

Correlation-induced synchronization of oscillations in olfactory bulb neurons

Roberto F Galán et al. J Neurosci. .

Abstract

Oscillations are a common feature of odor-evoked and spontaneous activity in the olfactory system in vivo and in vitro and are thought to play an important role in information processing and memory in a variety of brain areas. Theoretical and experimental studies have described several mechanisms by which oscillations can be generated and synchronized. Here, we investigate the hypothesis that correlated noisy inputs are able to generate synchronous oscillations in olfactory bulb mitral cells in vitro. We consider several alternative mechanisms and conclude that olfactory bulb synchronous oscillations are likely to arise because of the response of uncoupled oscillating neurons to aperiodic but correlated inputs. This mechanism has been described theoretically, but we provide the first experimental evidence that such a mechanism may underlie synchronization in real neurons. In physiological experiments, we show that this mechanism can generate gamma-band oscillations in populations of olfactory bulb mitral cells. This mechanism synchronizes oscillatory firing by using shared fast fluctuations in stochastic inputs across neurons, without requiring any synaptic or electrical coupling. We discuss the properties and limitations of synchronization by this mechanism and suggest that it may underlie fast oscillations in many brain areas.


Figures
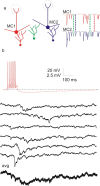
Figure 1.
Figure 1.
Properties of lateral IPSPs in the mouse olfactory bulb. a, Schematic showing two mitral cells (red and blue) receiving input from unshared (red and blue) and shared (green) granule cells. Spiking in green granule cells results in correlated IPSPs in the red and blue mitral cells. Inputs from such shared granule cells are proposed to be responsible for the correlated inputs that can give rise to the stochastic synchronization phenomenon described here. b, Voltage traces recorded from a pair of mitral cells in vitro coupled by disynaptic, granule cell-mediated inhibition. Spiking in one mitral cell (red trace) elicited by 100 ms current injection (400 pA) results in asynchronous IPSPs recorded in a second mitral cell (6 example traces, black). The average lateral IPSP (thick bottom trace) shows slow rise and slow decay times that are typical for unitary lateral IPSPs.
Figure 2.
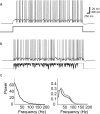
Figure 2.
Response of single mitral cell to IPSC noise input. a, Mitral cell spike train in response to constant current input. b, Response of same cell to 400 pA current plus Poisson distributed train of α functions that we refer to as “IPSC noise” (rate, 50/s; α = 3 ms; amplitude, 60 pA). c, Power spectrum of IPSC noise input current from b (left) and average power spectrum (right) of six mitral cells given steady-state (black) and IPSC noise current injections (gray). Addition of IPSP noise resulted in a slightly broader power spectrum, mainly by enhancing the low frequency component, without affecting the frequency of the peak of the power spectrum.
Figure 3.
Figure 3.
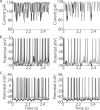
Increase of spike synchrony in response to correlated inputs. a, IPSC noise trains (see Materials and Methods) for two different values of Cin (left, Cin = 0.0; right, Cin = 0.8). b, Numerical simulations of two model cells in response to inputs in a. Spiking in response to uncorrelated inputs appears uncorrelated, whereas spiking in response to correlated inputs is correlated and appears periodic. c, Similar to b, but voltage traces are recorded during injection of gray and black current waveforms into two different mitral cells. Note that uncorrelated inputs (b, c, left) produce spike trains that are roughly periodic but totally uncorrelated. On the contrary, the spikes evoked by highly correlated inputs (b, c, right) occur at similar times and still appear periodic. This shows that the response of a single cell to a similar IPSC spike train can be highly reliable, and that correlated Poisson trains of α functions are sufficient to synchronize spiking across different mitral cells.
Figure 4.
Figure 4.
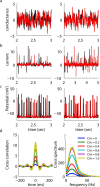
IPSC noise inputs produce synchronized oscillatory firing in mitral cells. a, Average cross-correlograms of mitral cell spike trains computed from data similar to those shown in Figure 3. Cross-correlograms were calculated for spike trains recorded from different cells in which IPSC noise inputs with indicated degrees of correlation were injected. Level of correlation between input currents ranged from completely uncorrelated (Cin = 0) to completely correlated (Cin = 1.0) in steps of 0.2. Data were collected from 17 mitral cells, with 66 total pair-wise comparisons made. b, From this same data set, we computed the average cross-power spectrum (power spectrum of the cross-correlogram) of the recorded sweeps elicited by IPSC noise inputs with varying degrees of correlation. These cross-power spectra showed a clear increase with the degree of input correlation in the gamma band, indicating that increased input correlation causes an increase in the tendency of mitral cells to fire in a synchronous oscillatory manner. c, The fraction of the integrated power (from the plots in b, above) in the 15–40 Hz frequency range increases with increasing input correlation, indicating that the increase in output correlation is selective for this frequency band. d–f, Correlated events in the input have no oscillatory patterns but occur randomly in time. d, Red and black traces are responses to IPSC noise trains with Cin = 0.4. The blue traces show IPSC events common to both black and red input currents. e, Autocorrelograms of traces in d. Black and red autocorrelograms are identical, indicating that both inputs have the same statistical properties. The autocorrelogram of the correlated events (blue) is a scaled version of black and red because of the lower number of events in the blue traces in a. Note that there is no oscillatory pattern in these autocorrelograms. f, Power spectra (red and black) and cross-power spectrum (blue) of the input currents in a. These decrease monotonically without showing a peak, indicating an oscillatory component in either the whole traces (black and red) or in the correlated part (blue).
Figure 5.
Figure 5.
Filtered white noise inputs produce synchronized oscillatory firing in mitral cells. a, Uncorrelated (left) and partially correlated (right) filtered white noise current injections delivered to mitral cell pairs. b, Spike trains resulting from injection of noise traces shown above. Similar to data from Figure 3 in which cells were injected with IPSC noise, cells fire in a somewhat rhythmic manner and show correlated oscillatory firing when injected with correlated noise. c, Left, Average cross-correlograms of mitral cell spike trains computed from data similar to those shown in b. Cross-correlograms were calculated for spike trains recorded from different cells in which filtered white noise inputs with indicated degrees of correlation were injected. The level of correlation between input currents ranged from completely uncorrelated (Cin = 0) to completely correlated (Cin = 1.0) in steps of 0.2. (right). From this same data set, we computed cross-power spectra of the recorded sweeps elicited by IPSC noise inputs with varying degrees of correlation. These cross-power spectra showed a clear increase with the degree of input correlation in the gamma band, indicating that increased input correlation causes an increase in the tendency of mitral cells to fire in a synchronous, oscillatory manner.
Figure 6.
Figure 6.
Conductance noise inputs produce synchronized oscillatory firing in simulated mitral cells. a, Weakly (Cin = 0.1, left) and strongly (Cin = 0.8, right) correlated filtered white noise conductance (Erev = −75 mV) injections delivered to simulated mitral cells. The scale is in arbitrary conductance units. b, Current injected because of the conductance changes shown above. c, Spike trains resulting from injection of noise traces shown above. Similar to data from Figures 3 in which simulated neurons were injected with IPSC noise, cells fire in a somewhat rhythmic manner and show correlated oscillatory firing when injected with correlated conductance noise. d, Left, average cross-correlograms of mitral cell spike trains computed from data similar to those shown in c. Cross-correlograms were calculated for spike trains from different simulated cells in which filtered white noise conductance inputs with indicated degrees of correlation were injected. Level of correlation between input currents ranged from completely uncorrelated (Cin = 0) to completely correlated (Cin = 1.0) in steps of 0.2. (right). From this same data set, we computed cross-power spectra of the recorded sweeps elicited by IPSC noise inputs with varying degrees of correlation. These cross-power spectra showed a clear increase with the degree of input correlation in the gamma band, indicating that increased input correlation causes an increase in the tendency of mitral cells to fire in a synchronous oscillatory manner.
Figure 7.
Figure 7.
Varying noise amplitude results in trade-off between synchrony and periodicity. a, The degree of output correlation increases with the amplitude of the input noise for correlated (Cin = 1.0, closed circles) but not uncorrelated (Cin = 0, open circles) filtered white noise inputs. Here, we plot the degree of input noise in terms of the SD of the membrane potential rather than of the input current to compensate for differences in membrane properties across neurons. Simulations (open and closed diamonds) show similar effects of noise amplitude when the magnitude of uncorrelated noise is ∼20% of the magnitude of the correlated noise. b, c, Experimental data (b) and simulations (c) and show the effect of the amplitude of correlated noise on the coherence of spike trains. For smaller noise amplitude (10–30 pA fluctuations) in b, the cross-power spectrum of neuronal output is not altered by the noisy correlated inputs, which shift only the relative timing of their action potentials. Therefore, the cross-power spectrum has a clear peak near the average firing rate of the neurons. In other words, the neurons filter the correlations on their intrinsic time scale. For larger noise amplitudes (40–60 pA in b), the periodicity of the neural firing is reduced and, as a consequence, the coherence peak broadens. Regardless of noise amplitude, the coherence rapidly decreases >40 Hz, which indicates that the neurons only take advantage of the input correlations that have a time scale is similar to or less than their intrinsic firing rate. c, A similar trade-off was seen in simulations. Values of input noise are as described in Materials and Methods.
Figure 8.
Figure 8.
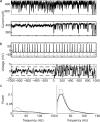
Stochastic synchronization occurs rapidly in response to a step change in input correlation. a, Top, Example single trace (of 10 similar traces) showing IPSC noise that was injected into a mitral cell. The rate and amplitude of the simulated IPSCs are constant across the two second traces. Bottom, Average across all 10 IPSC noise traces injected into mitral cells. Because of the step change in correlation across traces at t = 0, the average trace goes from nearly flat before t = 0 to having large fluctuations after t = 0. b, Top, Two example spike trains (one from a mitral cell and one from simulation) evoked by the inputs shown above in a. Firing pattern and rate are not obviously different for times before and after t = 0. Bottom, Estimated LFP calculated from all 10 cells injected with the IPSC noise having time-varying correlation shown above (black) and from a simulation of 10 neurons receiving the same inputs as were injected into the mitral cells. The amplitude of the estimated LFP increases rapidly after the step change in correlation. c, The average power spectra of the estimated LFPs of the mitral cell voltages (black) and from the simulated neurons (gray) recorded during the uncorrelated (left) or correlated (right) IPSC noise inputs show that the real and simulated mitral cells show strong oscillations after, but not before, the increase in input correlation.
Figure 9.
Figure 9.
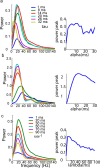
Dependence of oscillatory synchrony on spectral properties of the inputs. a, Left, Degree of synchronous oscillations as measured by the averaged cross-power spectrum (power spectrum of the cross-correlogram) is shown for simulated mitral cells (similar to Fig. 6c) when given IPSC noise consisting of α functions having τs ranging from 1 to 32 ms. Right, Plot of the peak of the cross-power spectra shown on the left of this figure versus the τ of the α function. The maximal cross-power spectrum peak was observed for α functions having times to peak ∼12 ms. Slower α functions (higher τs) reduced the peak and lowered the peak frequency. b, Similar to a except, instead of IPSC noise, the same effect was observed when white noise convolved with an α function with the indicated τ used as stimulus. c, Similar to a except the expected waiting time (average rate−1) of the Poisson process is varied for a fixed τ (2.5 ms). The peak is seen when there are, on average, several events per cycle. Altering the Poisson rate did not alter the peak frequency of the synchronized oscillations.

Similar articles

Cited by

References

    1. Abraham NM, Spors H, Carleton A, Margrie TW, Kuner T, Schaefer AT (2004). Maintaining accuracy at the expense of speed: stimulus similarity defines odor discrimination time in mice. Neuron 44:865–876. - PubMed
    1. Adrian ED (1942). Olfactory reactions in the brain of the hedgehog. J Physiol (Lond) 100:459–473. - PMC - PubMed
    1. Balu R, Larimer P, Strowbridge BW (2004). Phasic stimuli evoke precisely timed spikes in intermittently discharging mitral cells. J Neurophysiol 92:743–753. - PubMed
    1. Bressler SL, Freeman WJ (1980). Frequency analysis of olfactory system EEG in cat, rabbit, and rat. Electroencephalogr Clin Neurophysiol 50:19–24. - PubMed
    1. Bryant HL, Segundo JP (1976). Spike initiation by transmembrane current: a white-noise analysis. J Physiol (Lond) 260:279–314. - PMC - PubMed

Publication types

LinkOut - more resources