

rRNA and poly-beta-hydroxybutyrate dynamics in bioreactors subjected to feast and famine cycles
- PMID: 16597926
- PMCID: PMC1449019
- DOI: 10.1128/AEM.72.4.2322-2330.2006
rRNA and poly-beta-hydroxybutyrate dynamics in bioreactors subjected to feast and famine cycles
Abstract
Feast and famine cycles are common in activated sludge wastewater treatment systems, and they select for bacteria that accumulate storage compounds, such as poly-beta-hydroxybutyrate (PHB). Previous studies have shown that variations in influent substrate concentrations force bacteria to accumulate high levels of rRNA compared to the levels in bacteria grown in chemostats. Therefore, it can be hypothesized that bacteria accumulate more rRNA when they are subjected to feast and famine cycles. However, PHB-accumulating bacteria can form biomass (grow) throughout a feast and famine cycle and thus have a lower peak biomass formation rate during the cycle. Consequently, PHB-accumulating bacteria may accumulate less rRNA when they are subjected to feast and famine cycles than bacteria that are not capable of PHB accumulation. These hypotheses were tested with Wautersia eutropha H16 (wild type) and W. eutropha PHB-4 (a mutant not capable of accumulating PHB) grown in chemostat and semibatch reactors. For both strains, the cellular RNA level was higher when the organism was grown in semibatch reactors than when it was grown in chemostats, and the specific biomass formation rates during the feast phase were linearly related to the cellular RNA levels for cultures. Although the two strains exhibited maximum uptake rates when they were grown in semibatch reactors, the wild-type strain responded much more rapidly to the addition of fresh medium than the mutant responded. Furthermore, the chemostat-grown mutant culture was unable to exhibit maximum substrate uptake rates when it was subjected to pulse-wise addition of fresh medium. These data show that the ability to accumulate PHB does not prevent bacteria from accumulating high levels of rRNA when they are subjected to feast and famine cycles. Our results also demonstrate that the ability to accumulate PHB makes the bacteria more responsive to sudden increases in substrate concentrations, which explains their ecological advantage.
Figures
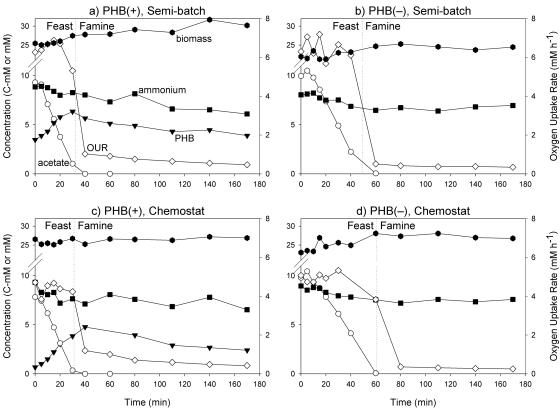
 ) (left axis) and oxygen uptake rates (mmol/liter · h) (⋄) (right axis) during a pulse experiment. (a) PHB(+) in a semibatch reactor. (b) PHB(−) in a semibatch reactor. (c) PHB(+) in a chemostat reactor. (d) PHB(−) in a chemostat reactor. Note that the left y axes are broken between 12 and 21 mM.
References
-
- American Public Health Association. 1992. Standard methods for the examination of water and wastewater. American Public Health Association, Washington, DC.
-
- Beun, J. J., F. Paletta, M. C. M. van Loosdrecht, and J. J. Heijnen. 2000. Stoichiometry and kinetics of poly-β-hydroxybutyrate metabolism in aerobic, slow growing, activated sludge cultures. Biotechnol. Bioeng. 67:379-389. - PubMed
-
- Bremer, H., and P. P. Dennis. 1996. Modulation of chemical composition and other parameters of the cell by growth rate, p. 1553-1569. In F. C. Neidhardt, R. Curtiss III, J. L. Ingraham, E. C. C. Lin, K. B. Low, B. Magasanik, W. S. Reznikoff, M. Riley, M. Schaechter, and H. E. Umbarger (ed.), Escherichia coli and Salmonella: cellular and molecular biology, 2nd ed. ASM Press, Washington, D.C.
-
- Champney, W. S. 1977. Kinetics of ribosome synthesis during a nutritional shift-up in Escherichia coli K-12. Mol. Gen. Genet. 152:259-266. - PubMed
-
- Chiesa, S. C., R. L. Irvine, and J. F. Manning, Jr. 1985. Feast/famine growth environments and activated sludge population selection. Biotechnol. Bioeng. 27:562-568. - PubMed
Publication types
MeSH terms
Substances
LinkOut - more resources
Full Text Sources
Other Literature Sources
Molecular Biology Databases
