

Abundance and distribution of Ostreococcus sp. in the San Pedro Channel, California, as revealed by quantitative PCR
- PMID: 16597949
- PMCID: PMC1449040
- DOI: 10.1128/AEM.72.4.2496-2506.2006
Abundance and distribution of Ostreococcus sp. in the San Pedro Channel, California, as revealed by quantitative PCR
Abstract
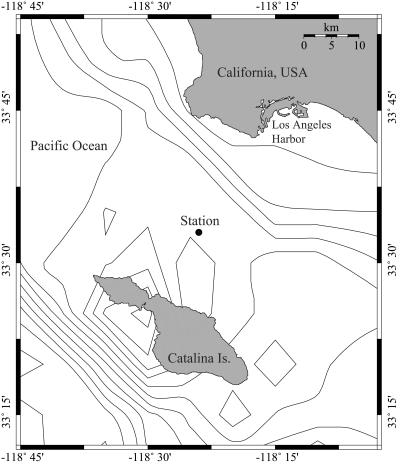
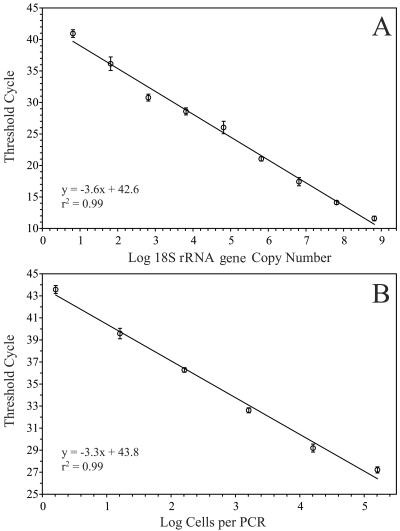
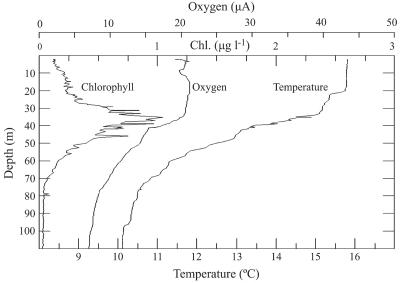
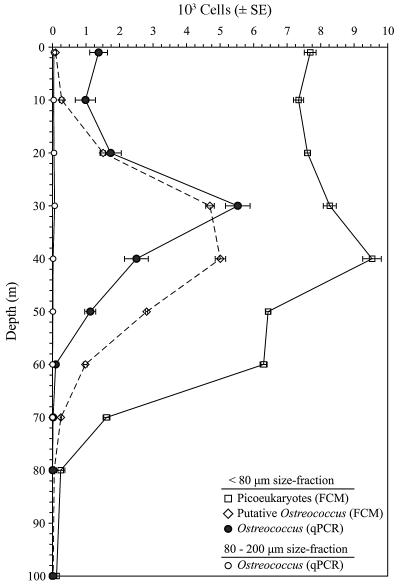
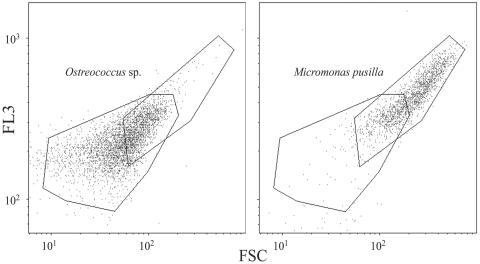
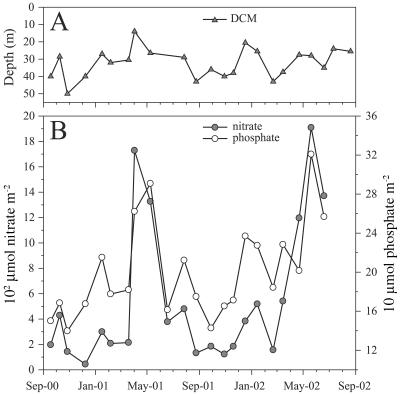
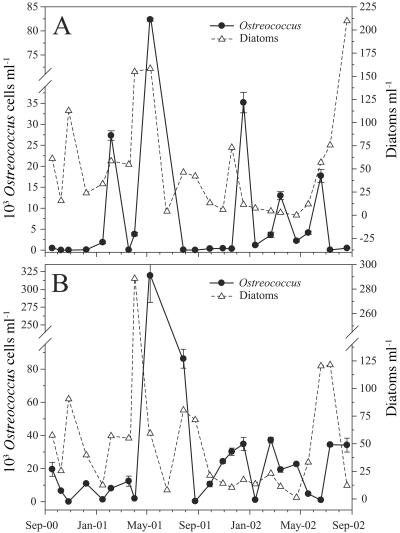
Ostreococcus is a genus of widely distributed marine phytoplankton which are picoplanktonic in size (<2 mum) and capable of rapid growth. Although Ostreococcus has been detected around the world, little quantitative information exists on its contribution to planktonic communities. We designed and implemented a genus-specific TaqMan-based quantitative PCR (qPCR) assay to investigate the dynamics and ecology of Ostreococcus at the USC Microbial Observatory (eastern North Pacific). Samples were collected from 5 m and the deep chlorophyll maximum (DCM) between September 2000 and August 2002. Ostreococcus abundance at 5 m was generally <5.0 x 10(3) cells ml(-1), with a maximum of 8.2 x 10(4) cells ml(-1). Ostreococcus abundance was typically higher at the DCM, with a maximum of 3.2 x 10(5) cells ml(-1). The vertical distribution of Ostreococcus was examined in March 2005 and compared to the distribution of phototrophic picoeukaryotes (PPE) measured by flow cytometry. The largest contribution to PPE abundance by Ostreococcus was approximately 70% and occurred at 30 m, near the DCM. Despite its relatively low abundance, the depth-integrated standing stock of Ostreococcus in March 2005 was approximately 30 mg C m(-2). Our work provides a new technique for quantifying the abundance of Ostreococcus and demonstrates the seasonal dynamics of this genus and its contribution to picoeukaryote biomass at our coastal sampling station.
Figures
Similar articles
-
Abundance and Biogeography of Picoprasinophyte Ecotypes and Other Phytoplankton in the Eastern North Pacific Ocean.Appl Environ Microbiol. 2016 Jan 4;82(6):1693-1705. doi: 10.1128/AEM.02730-15. Appl Environ Microbiol. 2016. PMID: 26729718 Free PMC article.
-
Global distribution patterns of distinct clades of the photosynthetic picoeukaryote Ostreococcus.ISME J. 2011 Jul;5(7):1095-107. doi: 10.1038/ismej.2010.209. Epub 2011 Feb 3. ISME J. 2011. PMID: 21289652 Free PMC article.
-
Mapping of picoeucaryotes in marine ecosystems with quantitative PCR of the 18S rRNA gene.FEMS Microbiol Ecol. 2005 Mar 1;52(1):79-92. doi: 10.1016/j.femsec.2004.10.006. Epub 2004 Dec 22. FEMS Microbiol Ecol. 2005. PMID: 16329895
-
Dynamics of marine bacterial and phytoplankton populations using multiplex liquid bead array technology.Environ Microbiol. 2010 Apr;12(4):975-89. doi: 10.1111/j.1462-2920.2004.02142.x. Epub 2010 Jan 26. Environ Microbiol. 2010. PMID: 20105218
-
Molecular diversity and seasonal dynamics of Ostreococcus (Mamiellophyceae, Chlorophyta) in typical mariculture bays based on metabarcoding analysis.Mar Environ Res. 2024 Nov;202:106764. doi: 10.1016/j.marenvres.2024.106764. Epub 2024 Sep 24. Mar Environ Res. 2024. PMID: 39332317
Cited by
-
Genotyping by sequencing for estimating relative abundances of diatom taxa in mock communities.BMC Ecol Evol. 2023 Feb 6;23(1):4. doi: 10.1186/s12862-023-02104-2. BMC Ecol Evol. 2023. PMID: 36747145 Free PMC article.
-
Genomic analysis of red-tide water bloomed with Heterosigma akashiwo in Geoje.PeerJ. 2018 May 29;6:e4854. doi: 10.7717/peerj.4854. eCollection 2018. PeerJ. 2018. PMID: 29868269 Free PMC article.
-
Abundance and Biogeography of Picoprasinophyte Ecotypes and Other Phytoplankton in the Eastern North Pacific Ocean.Appl Environ Microbiol. 2016 Jan 4;82(6):1693-1705. doi: 10.1128/AEM.02730-15. Appl Environ Microbiol. 2016. PMID: 26729718 Free PMC article.
-
A phospho-dawn of protein modification anticipates light onset in the picoeukaryote Ostreococcus tauri.J Exp Bot. 2023 Sep 29;74(18):5514-5531. doi: 10.1093/jxb/erad290. J Exp Bot. 2023. PMID: 37481465 Free PMC article.
-
Phytoplankton-group specific quantitative polymerase chain reaction assays for RuBisCO mRNA transcripts in seawater.Mar Biotechnol (NY). 2007 Nov-Dec;9(6):747-59. doi: 10.1007/s10126-007-9027-z. Epub 2007 Aug 13. Mar Biotechnol (NY). 2007. PMID: 17694413
References
-
- Andersen, R. A., S. L. Morton, and J. P. Sexton. 1997. Provasoli-Guillard National Center for Culture of Marine Phytoplankton 1997 list of strains. J. Phycol. 33(Suppl.):1-75.
-
- Andersen, R. A., G. W. Sauders, M. P. Paskind, and J. P. Sexton. 1993. Ultrastructure and 18S rRNA gene sequence for Pelagomonas calceolata gen. et sp. nov. and the description of a new algal class, the Pelagophyceae classis nov. J. Phycol. 29:701-715.
-
- Andersson, A., P. Haecky, and A. Hagstroem. 1994. Effect of temperature and light on the growth of micro-, nano- and pico-plankton: impact on algal succession. Mar. Biol. 120:511-520.
Publication types
MeSH terms
Substances
Associated data
- Actions
LinkOut - more resources
Full Text Sources
Molecular Biology Databases
