Comparative Study
. 2006 Apr;72(4):2586-93.
doi: 10.1128/AEM.72.4.2586-2593.2006.

Specific growth rate determines the sensitivity of Escherichia coli to thermal, UVA, and solar disinfection

Affiliations
Comparative Study

Specific growth rate determines the sensitivity of Escherichia coli to thermal, UVA, and solar disinfection

Michael Berney et al. Appl Environ Microbiol. 2006 Apr.

Abstract

Knowledge about the sensitivity of the test organism is essential for the evaluation of any disinfection method. In this work we show that sensitivity of Escherichia coli MG1655 to three physical stresses (mild heat, UVA light, and sunlight) that are relevant in the disinfection of drinking water with solar radiation is determined by the specific growth rate of the culture. Batch- and chemostat-cultivated cells from cultures with similar specific growth rates showed similar stress sensitivities. Generally, fast-growing cells were more sensitive to the stresses than slow-growing cells. For example, slow-growing chemostat-cultivated cells (D = 0.08 h(-1)) and stationary-phase bacteria from batch culture that were exposed to mild heat had very similar T(90) (time until 90% of the population is inactivated) values (T(90, chemostat) = 2.66 h; T(90, batch) = 2.62 h), whereas T(90) for cells growing at a mu of 0.9 h(-1) was 0.2 h. We present evidence that the stress sensitivity of E. coli is correlated with the intracellular level of the alternative sigma factor RpoS. This is also supported by the fact that E. coli rpoS mutant cells were more stress sensitive than the parent strain by factors of 4.9 (mild heat), 5.3 (UVA light), and 4.1 (sunlight). Furthermore, modeling of inactivation curves with GInaFiT revealed that the shape of inactivation curves changed depending on the specific growth rate. Inactivation curves of cells from fast-growing cultures (mu = 1.0 h(-1)) that were irradiated with UVA light showed a tailing effect, while for slow-growing cultures (mu = 0.3 h(-1)), inactivation curves with shoulders were obtained. Our findings emphasize the need for accurate reporting of specific growth rates and detailed culture conditions in disinfection studies to allow comparison of data from different studies and laboratories and sound interpretation of the data obtained.


Figures

FIG. 1.
FIG. 1.
(A) Field reactor for sunlight exposure of bacterial samples. The container is built from acrylic glass and has a quartz glass front window. Up to 25 tubes can be fitted into the container. Samples are stirred magnetically, and the temperature is controlled by a circulating water bath. The apparatus can be swiveled and turned in any direction. (B) Wavelength spectra of medium-pressure mercury lamps Hanau TQ718 (dashed line) and TQ718 Z4 (thin solid line) both corrected for filter solution NaNO3 and the sunlight spectrum on a mid-summer day measured at 1 p.m. (fat solid line).
FIG. 2.
FIG. 2.
E. coli growth curves and corresponding dissolved oxygen tension for different aeration systems in batch cultivation. The effect of stirring in Erlenmeyer flasks on the development of cell density (OD546) and pO2 was investigated and compared to growth in a fully aerated and stirred bioreactor. OD546 (•) and pO2 (dashed line) in an Erlenmeyer flask and OD546 (▴) and pO2 (solid line) in a bioreactor are shown.
FIG. 3.
FIG. 3.
Growth curve of E. coli K-12 MG1655 in LB batch culture (shaken Erlenmeyer flask) at 37°C (•, lnOD546). The specific growth rate μ (h−1) was calculated as the slope of five adjacent points (▴). Values are means ± standard deviations (error bars) for three experiments.
FIG. 4.
FIG. 4.
Sensitivity to mild heat (48°C) of E. coli K-12 MG1655 harvested at three different specific growth rates from LB batch culture (0 h−1 [⧫], 0.44 h−1 [▴], and 2 h−1 [•]). The values for unstressed control samples are displayed by open symbols. Sensitivity was determined as CFU/CFU at time zero.
FIG. 5.
FIG. 5.
Sensitivity to mild heat (48°C) of E. coli K-12 MG1655 cells cultivated in filter-sterilized LB medium in chemostat culture operated at different dilution rates (0.08 h−1 [▪], 0.2 h−1 [⧫], 0.3 h−1 formula image
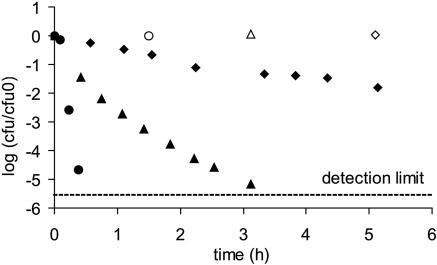
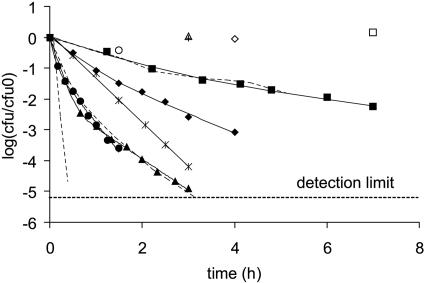
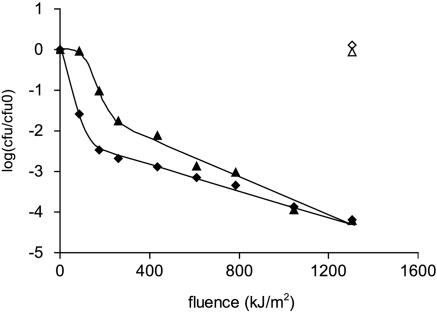
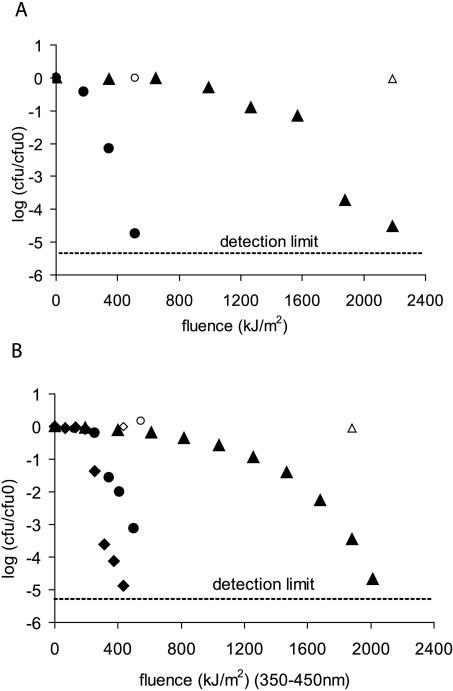
, 0.6 h−1[▴], and 0.9 h−1[•]). Curves were fitted with GInaFiT (14). The best fit is displayed for each curve. Inactivation curves from Fig. 4 are displayed as dashed lines for comparison. The values for unstressed control samples are displayed by open symbols. Sensitivity was determined as CFU/CFU at time zero.
FIG. 6.
FIG. 6.
Catalase specific activity (HPI [•] and HPII [▴]) of E. coli cells grown at different dilution rates in LB chemostat culture. Inactivation values T90 (□) (time when 90% of the population are inactivated measured by plate counting), derived from data in Fig. 5, are displayed. Catalase activity was not measured at the dilution rate 0.2 h−1. Values are means ± standard deviations (error bars) for three experiments. HPI activity was calculated as the difference between total catalase activity (HPI and HPII) minus HPII activity; therefore, no error bars are displayed for HPI activity.
FIG. 7.
FIG. 7.
Sensitivity to mild heat (48°C) of E. coli rpoS mutant cells harvested at different specific growth rates and cultivation conditions (0 h−1 in the LB batch [▴], 0.3 h−1 in the glucose mineral medium chemostat [•], and 1.5 h−1 in the LB batch [⧫]) compared to wild-type E. coli cells from stationary phase (0 h−1 in the LB batch [▪]). The values for unstressed controls are displayed by open symbols. Sensitivity was determined as CFU/CFU at time zero.
FIG. 8.
FIG. 8.
Sensitivity to UVA irradiation (TQ718 Z4) at 37°C of E. coli K-12 MG1655 harvested from LB chemostat cultures run at different dilution rates (0.3 h−1 [▴], 0.7 h−1 [•], and 1.0 h−1 [⧫]) compared to cells from stationary-phase batch cultures (μ = 0.0 h−1 [▪]). The values for unstressed control samples are displayed by open symbols. Curves were fitted with GInaFiT (14). The best fit is displayed for each curve. Sensitivity was determined as CFU/CFU at time zero.
FIG. 9.
FIG. 9.
Sensitivity to UVA irradiation (TQ718 Z4) at 37°C of E. coli K-12 MG1655 from LB chemostat culture run at a dilution rate of 1.0 h−1. Cells were either irradiated immediately after harvesting (⧫) or left to adjust to the new environment for 4 h before UV exposure (▴). The values for unstressed control samples are displayed by open symbols. Curves were fitted with GInaFiT (14). The best fit is displayed for each curve. Sensitivity was determined as CFU/CFU at time zero.
FIG. 10.
FIG. 10.
Sensitivity of E. coli K-12 wt (▴) and rpoS mutant (•) to UVA light (TQ718) (A) and to sunlight (B). Bacterial cells were harvested from stationary-phase LB batch cultures. (B) An inactivation curve for E. coli cells harvested at a μ of 2 h−1 (⧫) was added for comparison. The values for unstressed control samples are displayed by open symbols. Sensitivity was determined as CFU/CFU at time zero.

References

    1. Acra, A., Z. Raffoul, and Y. Karahagopian. 1984. Solar disinfection of drinking water and oral rehydration solutions. United Nations Children's Fund, New York, N.Y.
    1. Ali Azam, T., A. Iwata, A. Nishimura, S. Ueda, and A. Ishihama. 1999. Growth phase-dependent variation in protein composition of the Escherichia coli nucleoid. J. Bacteriol. 181:6361-6370. - PMC - PubMed
    1. Allan, B., M. Linseman, L. A. MacDonald, J. S. Lam, and A. M. Kropinski. 1988. Heat shock response of Pseudomonas aeruginosa. J. Bacteriol. 170:3668-3674. - PMC - PubMed
    1. Allwood, M. C., and A. D. Russell. 1970. Mechanisms of thermal injury in nonsporulating bacteria. Adv. Appl. Microbiol. 12:89-119. - PubMed
    1. Barry, V. C., M. L. Conalty, J. M. Denneny, and F. Winder. 1956. Peroxide formation in bacteriological media. Nature 178:596-597. - PubMed

Publication types