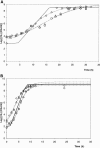
Effects of preculturing conditions on lag time and specific growth rate of Enterobacter sakazakii in reconstituted powdered infant formula
- PMID: 16597976
- PMCID: PMC1448981
- DOI: 10.1128/AEM.72.4.2721-2729.2006
Effects of preculturing conditions on lag time and specific growth rate of Enterobacter sakazakii in reconstituted powdered infant formula
Abstract
Enterobacter sakazakii can be present, although in low levels, in dry powdered infant formulae, and it has been linked to cases of meningitis in neonates, especially those born prematurely. In order to prevent illness, product contamination at manufacture and during preparation, as well as growth after reconstitution, must be minimized by appropriate control measures. In this publication, several determinants of the growth of E. sakazakii in reconstituted infant formula are reported. The following key growth parameters were determined: lag time, specific growth rate, and maximum population density. Cells were harvested at different phases of growth and spiked into powdered infant formula. After reconstitution in sterile water, E. sakazakii was able to grow at temperatures between 8 and 47 degrees C. The estimated optimal growth temperature was 39.4 degrees C, whereas the optimal specific growth rate was 2.31 h(-1). The effect of temperature on the specific growth rate was described with two secondary growth models. The resulting minimum and maximum temperatures estimated with the secondary Rosso equation were 3.6 degrees C and 47.6 degrees C, respectively. The estimated lag time varied from 83.3 +/- 18.7 h at 10 degrees C to 1.73 +/- 0.43 h at 37 degrees C and could be described with the hyperbolic model and reciprocal square root relation. Cells harvested at different phases of growth did not exhibit significant differences in either specific growth rate or lag time. Strains did not have different lag times, and lag times were short given that the cells had spent several (3 to 10) days in dry powdered infant formula. The growth rates and lag times at various temperatures obtained in this study may help in calculations of the period for which reconstituted infant formula can be stored at a specific temperature without detrimental impact on health.
Figures


References
-
- Baranyi, J., and T. A. Roberts. 1995. Mathematics of predictive food microbiology. Int. J. Food Microbiol. 26:199-218. - PubMed
-
- Begot, C., I. Desnier, J. D. Daudin, J. C. Labadie, and A. Lebert. 1996. Recommendations for calculating growth parameters by optical density measurements. J. Microbiol. Methods 25:225-232.
-
- Farmer, J. J., III, M. A. Asbury, F. W. Hickman, D. J. Brenner, and the Enterobacteriaceae study group. 1980. Enterobacter sakazakii: a new species of “Enterobacteriaceae” isolated from clinical specimens. Int. J. Syst. Bacteriol. 30:569-584.
-
- Heuvelink, A. E., M. Ahmed, F. D. Kodde, J. T. M. Zwartkruis-Nahuis, and E. de Boer. 2002. Enterobacter sakazakii in melkpoeder. De Ware (n) Chemicus 32:17-30.
-
- Iversen, C., M. Lane, and S. J. Forsythe. 2004. The growth profile, thermotolerance and biofilm formation of Enterobacter sakazakii grown in infant formula milk. Lett. Appl. Microbiol. 38:378-382. - PubMed
Publication types
MeSH terms
Substances
LinkOut - more resources
Full Text Sources
Medical
Molecular Biology Databases

