. 2006 May 7;273(1590):1165-71.
doi: 10.1098/rspb.2005.3432.

Quantifying lymphocyte kinetics in vivo using carboxyfluorescein diacetate succinimidyl ester (CFSE)

Affiliations

Quantifying lymphocyte kinetics in vivo using carboxyfluorescein diacetate succinimidyl ester (CFSE)

Becca Asquith et al. Proc Biol Sci. .

Abstract

The cytoplasmic dye carboxyfluorescein diacetate succinimidyl ester (CFSE) is used to quantify cell kinetics. It is particularly important in studies of lymphocyte homeostasis where its labelling of cells irrespective of their stage in the cell cycle makes it preferable to deuterated glucose and BrdU, which only label dividing cells and thus produce unrepresentative results. In the past, experiments have been limited by the need to obtain a clear separation of CFSE peaks forcing scientists to adopt a strategy of in vitro labelling of cells followed by their injection into the host. Here we develop a framework for analysis of in vivo CFSE labelling data. This enables us to estimate the rate of proliferation and death of lymphocytes in situ, and thus represents a considerable advance over current procedures. We illustrate this approach using in vivo CFSE labelling of B lymphocytes in sheep.


Figures

Figure 1
Figure 1
Schematic diagram to illustrate the difference between CFSE labelling in vitro and in vivo. (a) CFSE labelling in vitro typically produces homogeneous labelling so that (b) subsequent division peaks are easily resolvable. (c) CFSE labelling in vivo produces more heterogeneous labelling that (d) masks subsequent division peaks.
Figure 2
Figure 2
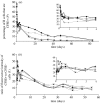
CFSE labelling of peripheral blood B cells in four sheep. CFSE labelling of peripheral blood B cells as a function of time since the CFSE injection. (a) The proportion of B cells that are CFSE+. (b) The ratio of the MFI of CFSE+ cells to the MFI of CFSE− cells. Insets show change in proportion and ratio over the first 4 days. Closed diamonds, sheep 4533; closed squares, sheep 4534; closed triangles, sheep 4535; crosses, sheep 4536.
Figure 3
Figure 3
Schematic of the model to describe CFSE labelled cells. Peripheral blood lymphocytes were assumed to proliferate at an average rate p, to disappear at an average rate d and to be replaced at an average rate λ. On division, the fluorescence intensity (initially J) was assumed to halve. After five divisions, CFSE fluorescence intensity was so low that it fell below the threshold of detection and the cell was considered to be unlabelled.
Figure 4
Figure 4
Best fit of the model to the data. The graphs show the experimentally observed data from t=1.92 onwards. Closed squares, proportion (P) of CFSE+ B cells experimental data; closed triangles, intensity (I) of CFSE labelling experimental data; dotted and unbroken lines, best theoretical fit.

Similar articles

Cited by

References

    1. Asquith B, Debacq C, Macallan D.C, Willems L, Bangham C.R. Lymphocyte kinetics: the interpretation of labelling data. Trends Immunol. 2002;23:596–601. 10.1016/S1471-4906(02)02337-2 - DOI - PubMed
    1. De Boer R.J, Mohri H, Ho D.D, Perelson A.S. Estimating average cellular turnover from 5-bromo-2′-deoxyuridine (BrdU) measurements. Proc. R. Soc. B. 2003a;270:849–858. 10.1098/rspb.2002.2299 - DOI - PMC - PubMed
    1. De Boer R.J, Mohri H, Ho D.D, Perelson A.S. Turnover rates of B cells, T cells, and NK cells in simian immunodeficiency virus-infected and uninfected rhesus macaques. J. Immunol. 2003b;170:2479–2487. - PubMed
    1. Debacq, C. et al Submitted. Peripheral blood B cell death compensates for excessive proliferation in lymphoid tissues and maintains homeostasis in an ovine model of leukemia. J. Immunol - PMC - PubMed
    1. Debacq C, Asquith B, Kerkhofs P, Portetelle D, Burny A, Kettmann R, Willems L. Increased cell proliferation, but not reduced cell death, induces lymphocytosis in bovine leukemia virus-infected sheep. Proc. Natl Acad. Sci. USA. 2002;99:10 048–10 053. 10.1073/pnas.142100999 - DOI - PMC - PubMed

Publication types