. 2006 Apr 18;103(16):6248-51.
doi: 10.1073/pnas.0510397103. Epub 2006 Apr 6.

Antarctic birds breed later in response to climate change

Affiliations

Antarctic birds breed later in response to climate change

Christophe Barbraud et al. Proc Natl Acad Sci U S A. .

Abstract

In the northern hemisphere, there is compelling evidence for climate-related advances of spring events, but no such long-term biological time series exist for the southern hemisphere. We have studied a unique data set of dates of first arrival and laying of first eggs over a 55-year period for the entire community of Antarctic seabirds in East Antarctica. The records over this long period show a general unexpected tendency toward later arrival and laying, an inverse trend to those observed in the northern hemisphere. Overall, species now arrive at their colonies 9.1 days later, on average, and lay eggs an average of 2.1 days later than in the early 1950s. Furthermore, these delays are linked to a decrease in sea ice extent that has occurred in eastern Antarctica, which underlies the contrasted effects of global climate change on species in Antarctica.


Conflict of interest statement

Conflict of interest statement: No conflicts declared.

Figures

Fig. 1.
Fig. 1.
Map indicating the location of Adélie Land in Antarctica and the study sites near Dumont d'Urville. Most seabird species nest and are studied on the largest island, where the Dumont d'Urville research station is located (square).
Fig. 2.
Fig. 2.
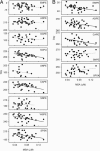
Phenological changes. (A) Dates of first arrival for the emperor penguin, Aptenodytes forsteri (EMPE) (r2 = 0.001; P = 0.81); Adélie penguin, P. adeliae (ADPE) (r2 = 0.03; P = 0.30); southern giant petrel, M. giganteus (SGPE) (r2 = 0.06; P = 0.20); southern fulmar, F. glacialoides (SOFU) (r2 = 0.38; P < 0.001); Antarctic petrel, T. antarctica (ANPE) (r2 = 0.21; P = 0.04); Cape petrel, D. capense (CAPE) (r2 = 0.17; P = 0.01); snow petrel, Pagodroma nivea (SNPE) (r2 = 0.001; P = 0.83); Wilson's storm petrel, O. oceanicus (WSPE) (r2 = 0.11; P = 0.05); and south polar skua C. maccormicki (SPSK) (r2 = 0.07; P = 0.09). (B) Dates of laying of first eggs. Data are shown for EMPE (r2 = 0.12; P = 0.11), ADPE (r2 = 0.19; P < 0.01), CAPE (r2 = 0.16; P = 0.03), SNPE (r2 = 0.004; P = 0.73), and SPSK (r2 = 0.11; P = 0.05). Regression lines indicate significance of the trends (solid line, P < 0.05; dotted line, P > 0.05).
Fig. 3.
Fig. 3.
Climate changes. (A) Southern Annular Mode (SAM) (r2 = 0.65; P < 0.001) as defined in ref. . (B) Southern Oscillation Index (SOI) (r2 = 0.08; P = 0.03). (C) Average annual air temperatures recorded at the Dumont d'Urville meteorological station (1956–2002) (r2 = 0.01; P = 0.47). (D) Methanesulfonic acid concentration (MSA) (r2 = 0.32; P < 0.001) as a proxy for sea ice extent from an ice core in East Antarctica (13). Values were redrawn from ref. . (E) Sea ice season length (SIL) for the sector 136°E to 142°E and north of 65°S (r2 = 0.13; P = 0.09). Data are from ref. ; updates were kindly provided by C. L. Parkinson (NASA Goddard Space Flight Center, Greenbelt, MD). Regression lines indicate significance of the trends (solid line, P < 0.05; dotted line, P > 0.05).
Fig. 4.
Fig. 4.
Phenological changes and sea ice extent. (A) Dates of first arrival advanced significantly with increasing sea ice extent for the southern fulmar (r2 = 0.17; P = 0.02), Cape petrel (r2 = 0.24; P = 0.004), Wilson's storm petrel (r2 = 0.17; P = 0.02), and south polar skua (r2 = 0.16; P = 0.03). (B) Dates of laying of first eggs advanced significantly with increasing sea ice extent for the emperor penguin (r2 = 0.15; P = 0.02), Adélie penguin (r2 = 0.12; P = 0.05), and Cape petrel (r2 = 0.19; P = 0.04). Solid lines indicate significant (P < 0.05) regressions. Abbreviations are as described in the legend of Fig. 2.

References

    1. Beebee T. J. C. Nature. 1995;374:219–220.
    1. Crick H. Q. P., Dudley C., Glue D. E., Thomson D. L. Nature. 1997;388:526.
    1. Walther G. R., Post E., Convey P., Menzel A., Parmesan C., Beebee T. J. C., Fremont J.-M., Hoegh-Guldberg O., Bairlein F. Nature. 2002;416:389–395. - PubMed
    1. Parmesan C., Yohe G. Nature. 2003;421:37–42. - PubMed
    1. Root T. L., Price J. T., Hall K. R., Schneider S. H., Rosenzweig C., Pounds A. J. Nature. 2003;421:57–60. - PubMed

Publication types