. 2006 May 3;25(9):1934-44.
doi: 10.1038/sj.emboj.7601079. Epub 2006 Apr 6.

Poly(A) binding protein (PABP) homeostasis is mediated by the stability of its inhibitor, Paip2

Affiliations

Poly(A) binding protein (PABP) homeostasis is mediated by the stability of its inhibitor, Paip2

Madoka Yoshida et al. EMBO J. .

Abstract

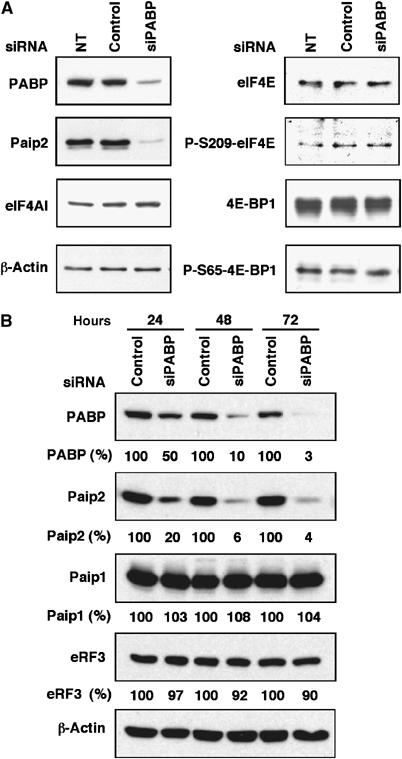
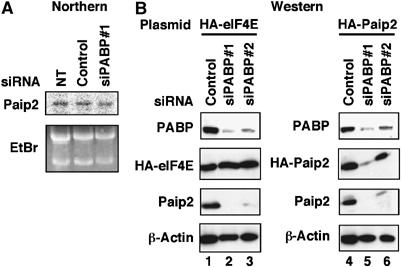
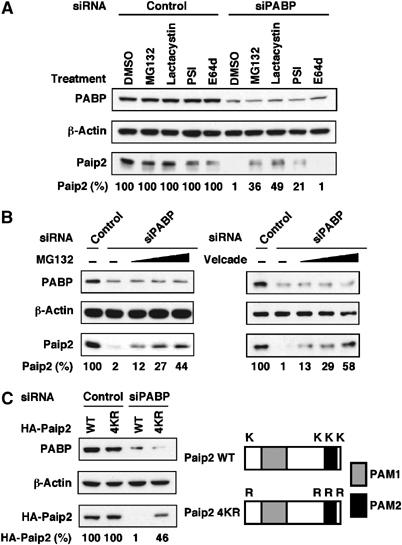
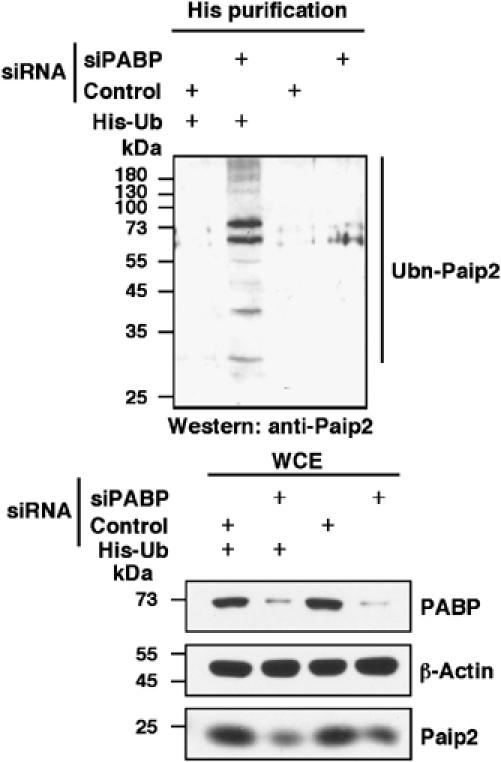
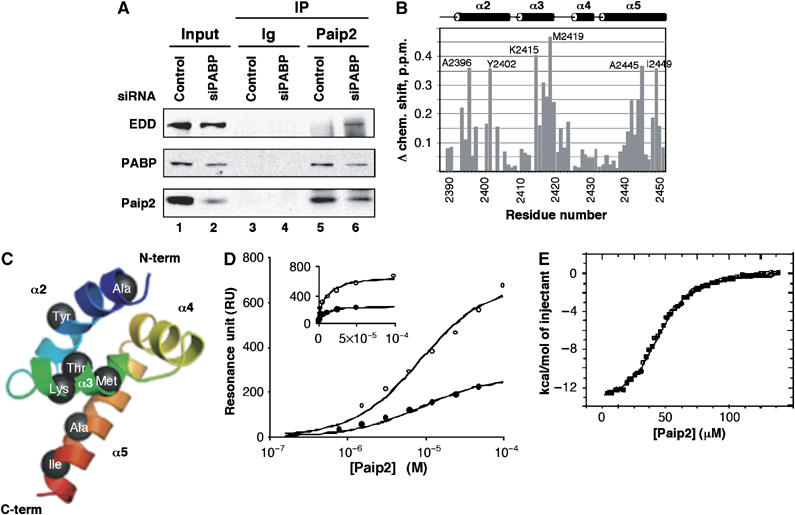
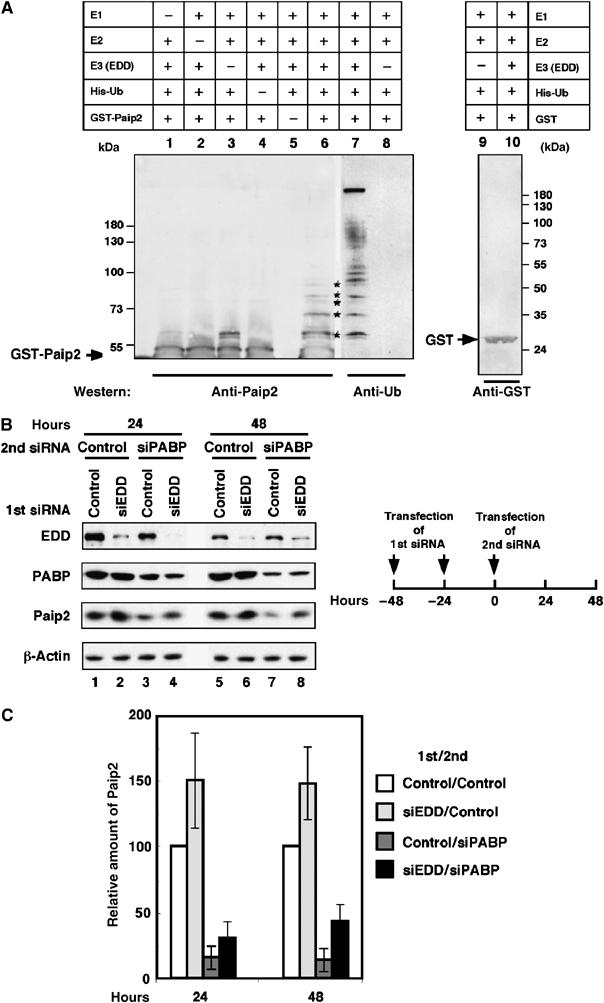
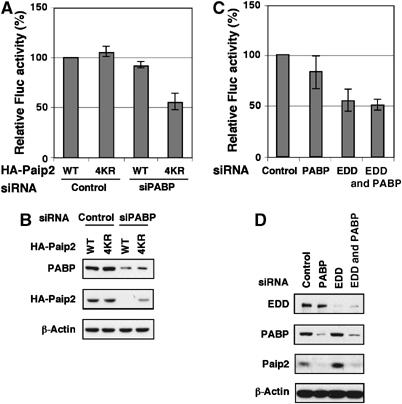
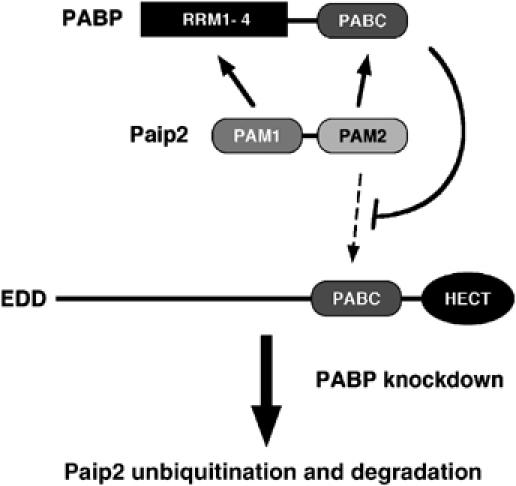
The poly(A)-binding protein (PABP) is a unique translation initiation factor in that it binds to the mRNA 3' poly(A) tail and stimulates recruitment of the ribosome to the mRNA at the 5' end. PABP activity is tightly controlled by the PABP-interacting protein 2 (Paip2), which inhibits translation by displacing PABP from the mRNA. Here, we describe a close interplay between PABP and Paip2 protein levels in the cell. We demonstrate a mechanism for this co-regulation that involves an E3 ubiquitin ligase, EDD, which targets Paip2 for degradation. PABP depletion by RNA interference (RNAi) causes co-depletion of Paip2 protein without affecting Paip2 mRNA levels. Upon PABP knockdown, Paip2 interacts with EDD, which leads to Paip2 ubiquitination. Supporting a critical role for EDD in Paip2 degradation, knockdown of EDD expression by siRNA leads to an increase in Paip2 protein stability. Thus, we demonstrate that the turnover of Paip2 in the cell is mediated by EDD and is regulated by PABP. This mechanism serves as a homeostatic feedback to control the activity of PABP in cells.


Figures

Figure 1
Figure 1
siRNA-mediated PABP depletion results in reduced Paip2 levels. (A) HeLa cells were transfected with control siRNA or PABP siRNA (siPABP#1) for 72 h, and extracts were subjected to Western blot analysis with the indicated antibodies. NT, nontransfected. (B) Extracts were collected at the indicated time points and subjected to Western blot analysis with the indicated antibodies. Data are expressed as the percentage of PABP, Paip1, Paip2, and eRF3 amounts relative to those in control siRNA-transfected cells (set at 100%). The results are representative of two independent experiments.
Figure 2
Figure 2
Paip2 is reduced at the protein level in PABP-depleted cells. (A) Northern blot analysis of Paip2 mRNA was performed using total RNA isolated from HeLa cells after 72 h of transfection with the indicated siRNAs (top panel). Ribosomal RNAs (28S and 18S) served as loading controls (bottom panel). NT, nontransfected. (B) HeLa cells were transfected with either HA-eIF4E (lanes 1–3) or HA-Paip2 (lanes 4–6) plasmids. At 24 h after transfection, cells were transfected with control siRNA (lanes 1 and 4), PABP siRNA (siPABP#1; lanes 2 and 5) or PABP siRNA (siPABP#2; lanes 3 and 6). Cells were harvested 48 h later, and extracts were subjected to Western blot analysis with the indicated antibodies. The results are representative of two independent experiments.
Figure 3
Figure 3
Paip2 levels are regulated by the ubiquitin-proteasome system. (A) Proteasome inhibition causes Paip2 accumulation in PABP-depleted cells. HeLa cells were transfected with control or PABP siRNAs. At 24 h after transfection, cells were treated with either DMSO or with 20 μM each of MG132, Lactacystin, PSI or E64d for 6 h. Cell extracts were then subjected to Western blot analysis with anti-PABP and anti-Paip2 antibodies. Data are expressed as the percentage of Paip2 amount relative to that in control siRNA-transfected cells (set at 100%). (B) At 24 h after siRNA transfection, cells were treated with either DMSO or with increasing concentrations (10, 20 and 40 μM) of MG132 (left panel) or (50, 100 and 200 nM) of Velcade (right panel) for 6 h and then analyzed as in (A). (C) Degradation of Paip2 in PABP knockdown cells is diminished by lysine mutations. Schematic representation of Paip2 WT and Paip2 4KR in which all the lysine residues were replaced by arginines (K2R, K108R, K116R and K123R). Gray and black boxes represent PAM1 and PAM2, respectively. HeLa cells were transfected with the indicated Paip2 plasmids. At 24 h after transfection, cells were transfected with siRNAs and then analyzed as in (A). The results are representative of two independent experiments.
Figure 4
Figure 4
PABP depletion increases Paip2 ubiquitination. HeLa cells were transfected with plasmid encoding His-ubiquitin (His-Ub) or empty vector. At 24 h after transfection, cells were transfected with control or PABP siRNA, and treated with the proteasome inhibitor MG132. His-tagged ubiquitinated proteins were purified using TALON metal affinity resin and anti-Paip2 antibody was used to detect ubiquitinated Paip2 (Ubn-Paip2). Whole-cell extracts (WCE) were subjected to Western blot analysis with the indicated antibodies.
Figure 5
Figure 5
Paip2 interacts with EDD in vivo and in vitro. (A) Interaction of endogenous Paip2 and EDD. Extracts from HeLa cells transfected with control or PABP siRNA for 48 h were subjected to immunoprecipitation (IP) with preimmune rabbit serum (Ig) or anti-Paip2 antibody. The immunoprecipitates were subjected to Western blot analysis with anti-EDD, anti-PABP, and anti-Paip2 antibodies. As a negative control, immunoprecipitates obtained with preimmune rabbit serum (Ig) were used. Input fraction represents 5% of the cell extract used for IP. (B) Paip2-peptide binding to the PABC domain of EDD. Plot of amide chemical shift changes of PABC domain upon addition of the Paip2 peptide. The chemical shift changes were calculated as (ΔHN2+(0.15*ΔN)2)1/2. The most affected amides are labeled. The secondary structure is shown above. (C) Mapping of chemical shift changes on the EDD PABC crystal structure (PDB ID code 1I2 T). Residues with shifts greater than 0.3 ppm are labeled. The figure was generated using MacPyMOL. (D) Measurement of PABC EDD/Paip2 peptide apparent affinity using SPR. The symbols correspond to the average of control-corrected plateau responses (steady-state equilibrium) monitored for Paip2 peptide solutions injected at various concentrations over coupled PABC EDD at two different loadings corresponding to 4000 RU (open symbols) and 1300 RU (closed symbols). Solid lines correspond to the best global fit for binding to a single site. The insert shows the same data plotted with a linear axis for the peptide concentration. (E) Calorimetric titration of EDD (2393–2452) with Paip2 (106–127) at 298 K. The panel shows the integrated heat of each injection after correction for the heat of dilution of Paip2 and normalization for the amount of Paip2 injected. The curve represents the best fit to a model involving a single set of independent sites.
Figure 6
Figure 6
Ubiquitination of Paip2 is mediated by EDD. (A) Ubiquitination of Paip2 by EDD in vitro. EDD, isolated by immunoprecipitation with anti-EDD antibodies from rat testis lysate, was incubated with E1, E2 (UBC4-1), His-ubiquitin, ubiquitin aldehyde, AMP-PNP and either GST-Paip2 or GST. Products were then isolated by using glutathione coupled beads. Higher molecular weight ubiquitinated forms of GST-Paip2 (lane 6, asterisks) were detected by immunoblotting with anti-Paip2. As negative controls, immunoprecipitates obtained with preimmune rabbit IgG were used in the in vitro ubiquitination assay (lane 3) or reactions were carried out with GST as substrate and detected with anti-GST antibodies (lanes 9 and 10). To confirm that the higher molecular weight bands in lane 6 contained ubiquitin, replicates of samples used in lanes 3 and 6 were analyzed by immunoblotting with anti-ubiquitin antibody (lanes 7 and 8). Bands of ubiquitinated GST-Paip2 are marked with asterisks. The positions of GST and GST-Paip2 are indicated by arrows. (B) Depletion of EDD by RNAi prevents Paip2 degradation. HeLa cells were transfected consecutively at a 24-h interval with control or EDD siRNA. At 24 h following the second transfection, cells were transfected with control siRNA or PABP siRNA. At 24 and 48 h after the second siRNA transfection, cell extracts were subjected to Western blot analysis with anti-EDD, anti-PABP and anti-Paip2 antibodies. (C) Histogram of the relative amount of Paip2 from (B). Data are expressed as the percentage of Paip2 amount relative to that in control siRNA-transfected cells (set at 100%). Error bars denote the standard error of four independent experiments.
Figure 7
Figure 7
siRNA-mediated reduction of PABP affects translation. (A) HeLa cells were transfected with the indicated HA-Paip2 plasmids and siRNAs as in Figure 3C. At 24 h following the second transfection, cells were transfected with in vitro transcribed capped Fluc mRNA. Cells were harvested 6 h later, and extracts were subjected to Luciferase assay. Data are expressed as the percentage of Fluc activity in cells transfected with control siRNA and WT HA-tagged Paip2 (set at 100%). Error bars denote the standard deviation from three independent experiments. (B) Western blot analysis of the cell extracts from (A) was performed with the indicated antibodies. (C) HeLa cells were transfected with the indicated siRNAs as in Figure 6B. At 24 h following the second siRNA transfection, cells were transfected with Fluc mRNA and then analyzed as in (A). Data are expressed as the percentage of Fluc activity in cells transfected with control siRNA (set at 100%). Error bars denote the standard deviation from three independent experiments. (D) Western blot analysis of the cell extracts from (C) was performed with the indicated antibodies.
Figure 8
Figure 8
Model of ubiquitin-dependent degradation of Paip2. Two PABC-containing proteins, PABP and EDD, regulate the turnover of Paip2.

References

    1. Adams J (2001) Proteasome inhibition in cancer: development of PS-341. Semin Oncol 28: 613–619 - PubMed
    1. Bonifacino JS, Cosson P, Klausner RD (1990) Colocalized transmembrane determinants for ER degradation and subunit assembly explain the intracellular fate of TCR chains. Cell 63: 503–513 - PubMed
    1. Callaghan MJ, Russell AJ, Woollatt E, Sutherland GR, Sutherland RL, Watts CK (1998) Identification of a human HECT family protein with homology to the Drosophila tumor suppressor gene hyperplastic discs. Oncogene 17: 3479–3491 - PubMed
    1. Campanero MR, Flemington EK (1997) Regulation of E2F through ubiquitin–proteasome-dependent degradation: stabilization by the pRB tumor suppressor protein. Proc Natl Acad Sci USA 94: 2221–2226 - PMC - PubMed
    1. Chau V, Tobias JW, Bachmair A, Marriott D, Ecker DJ, Gonda DK, Varshavsky A (1989) A multiubiquitin chain is confined to specific lysine in a targeted short-lived protein. Science 243: 1576–1583 - PubMed

Publication types

MeSH terms