. 2006 May 3;25(9):1883-94.
doi: 10.1038/sj.emboj.7601077. Epub 2006 Apr 6.

Autoregulatory control of the p53 response by caspase-mediated processing of HIPK2

Affiliations

Autoregulatory control of the p53 response by caspase-mediated processing of HIPK2

Ekaterina Gresko et al. EMBO J. .

Abstract

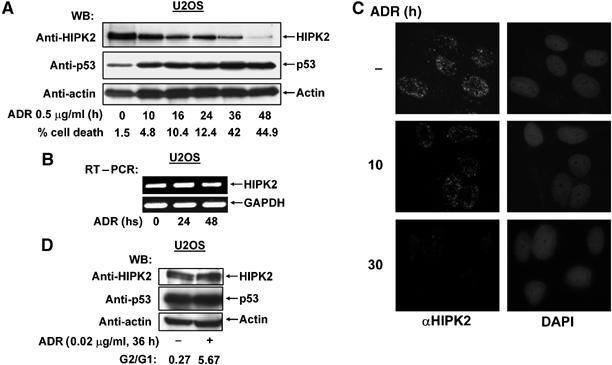
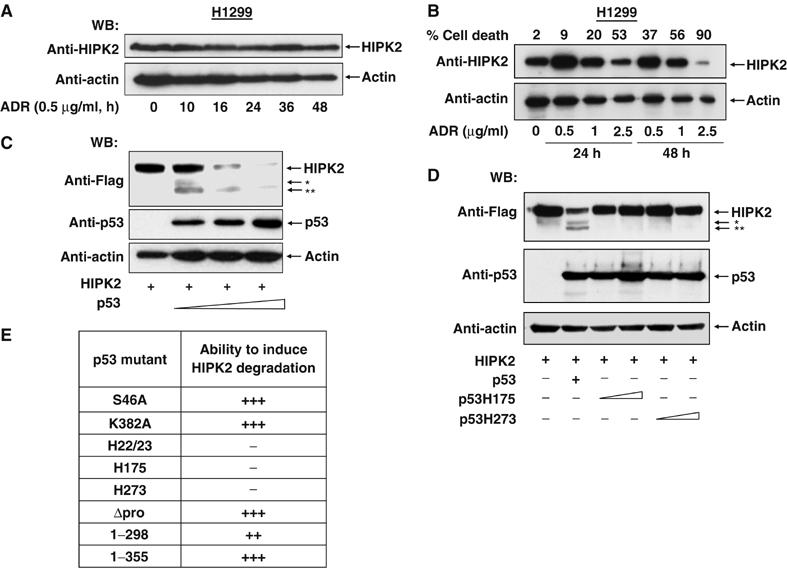
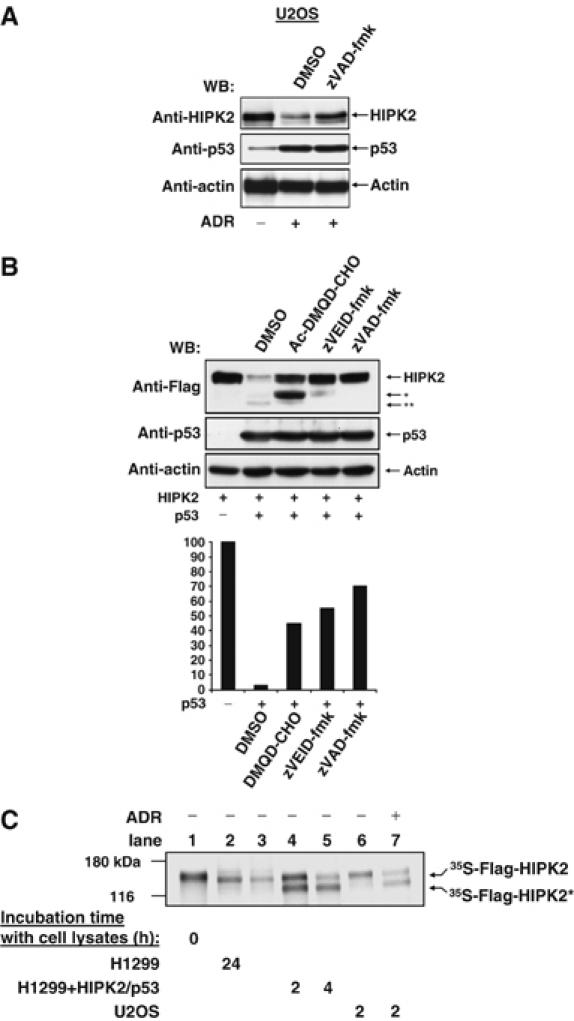
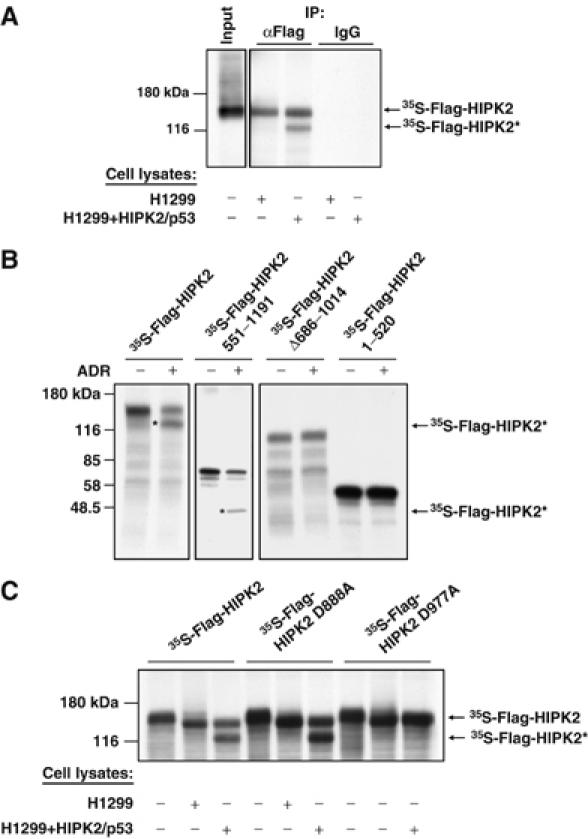
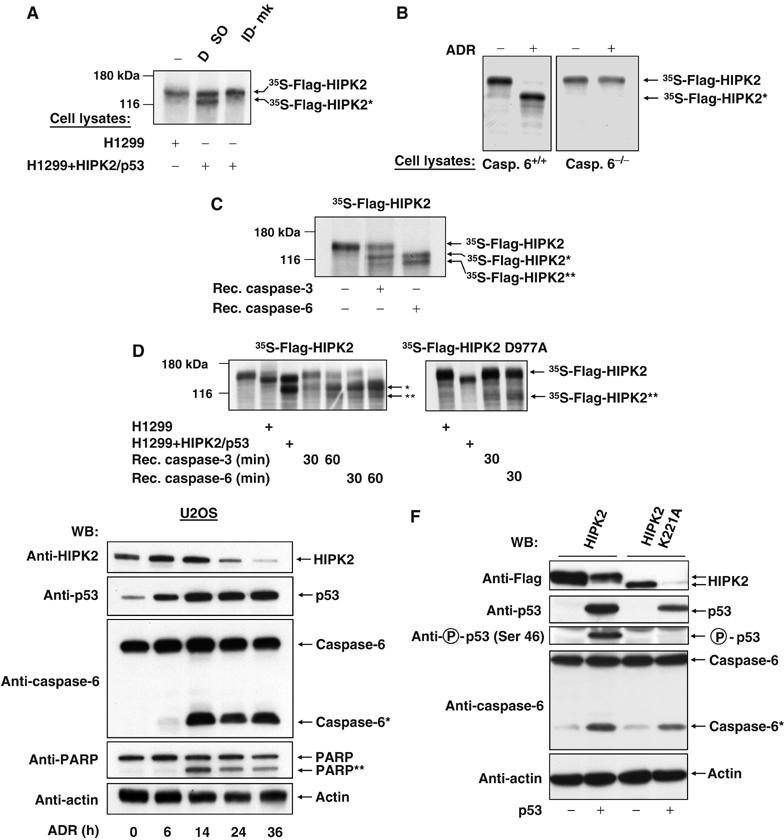
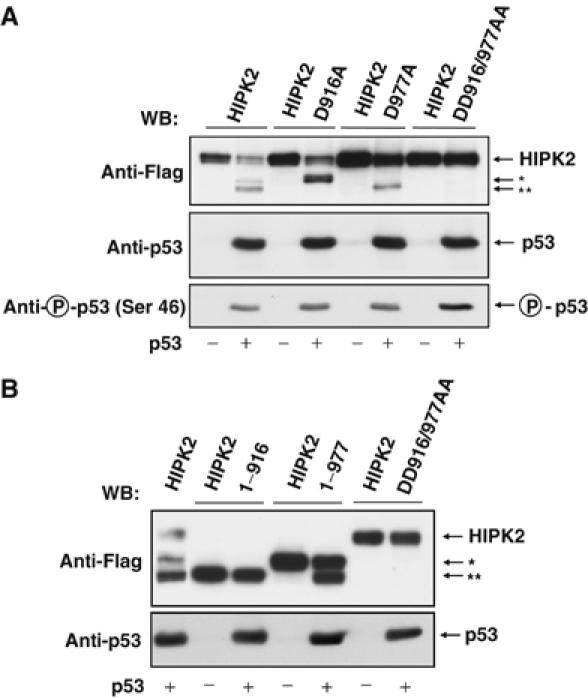
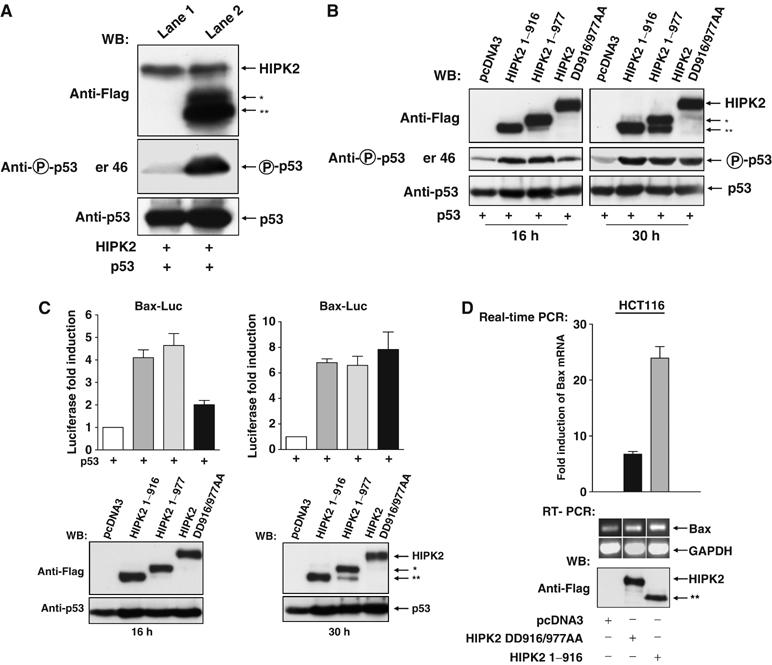
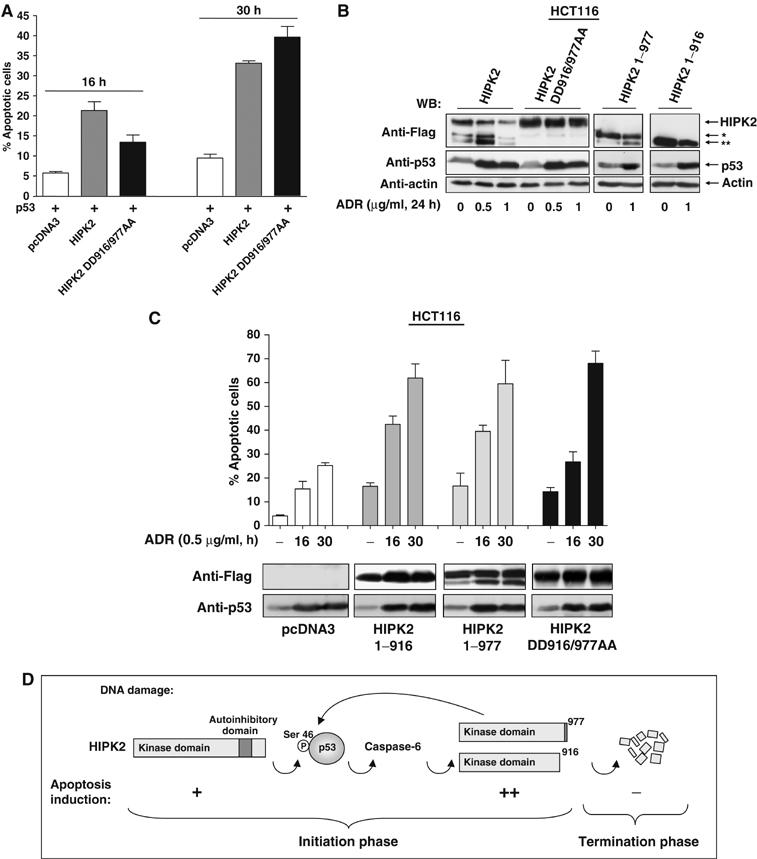
The serine/threonine kinase HIPK2 phosphorylates the p53 protein at Ser 46, thus promoting p53-dependent gene expression and subsequent apoptosis. Here, we show that DNA damaging chemotherapeutic drugs cause degradation of endogenous HIPK2 dependent on the presence of a functional p53 protein. Early induced p53 allows caspase-mediated cleavage of HIPK2 following aspartic acids 916 and 977. The resulting C-terminally truncated HIPK2 forms show an enhanced induction of the p53 response and cell death, thus allowing the rapid amplification of the p53-dependent apoptotic program during the initiation phase of apoptosis by a regulatory feed-forward loop. The active HIPK2 fragments are further degraded during the execution and termination phase of apoptosis, thus ensuring the occurrence of HIPK2 signaling only during the early phases of apoptosis induction.


Figures

Figure 1
Figure 1
DNA damage triggers HIPK2 degradation. (A) U2OS cells were treated for the indicated periods with adriamycin (ADR). Equal amounts of proteins contained in cell extracts were separated by SDS–PAGE and analyzed by Western blotting (WB) for the occurrence of endogenous HIPK2, p53 and the loading control β-actin as shown. Apoptosis in these cells was quantified by FACS analysis, typical values are shown. (B) U2OS cells were treated with adriamycin (0.5 μg/ml) as shown. Relative mRNA levels of HIPK2 and the control GAPDH were determined by RT–PCR with specific primers, an ethidium bromide-stained agarose gel is displayed. (C) U2OS cells were treated with adriamycin (0.5 μg/ml) as shown and the localization of endogenous HIPK2 was revealed by indirect immunefluorescence. Nuclear DNA was stained with DAPI. (D) U2OS cells remained untreated or received 0.02 μg/ml adriamycin for 36 h. Cells were analyzed by FACS analysis for cell cycle distribution and by Western blotting for the occurrence of HIPK2, p53 and β-actin.
Figure 2
Figure 2
p53 activation triggers HIPK2 degradation. (A) p53-deficient H1299 cells were treated and analyzed as in (Figure 1A). (B) H1299 cells were treated with increasing concentrations of adriamycin for 24 or 48 h as shown. Cells were analyzed for apoptosis and by Western blotting for HIPK2 and the loading control β-actin. Note that cells showing massive apoptosis also contain less of the loading control. (C) H1299 cells were transiently transfected to express a constant amount of Flag-tagged HIPK2 and increasing concentrations of p53. Cell extracts were prepared and the occurrence of HIPK2 and p53 was detected by immunoblotting. The positions of HIPK2* and HIPK2** cleavage products are indicated. (D) H1299 cells were transfected to express Flag-HIPK2 in the absence or presence of p53 or escalating doses of the indicated p53 point mutants. After 24 h, cell extracts were prepared and analyzed by Western blotting. (E) Summary of the experiments measuring the impact of p53 mutants on their ability to trigger HIPK2 processing (+++ complete cleavage, ++ cleavage less efficient, − no cleavage).
Figure 3
Figure 3
Caspase-dependent HIPK2 cleavage. (A) U2OS cells were treated for 24 h with adriamycin (0.5 μg/ml) and incubated in the presence of zVAD-fmk (25 μM) or DMSO as a solvent control as shown. Immunoblotting revealed the occurrence of HIPK2 and p53. (B) Upper: H1299 cells transiently expressing HIPK2 and p53 were incubated with Ac-DMQD-CHO, zVEID-fmk or zVAD-fmk (25 μM each) and analyzed for protein expression by immunoblotting. The positions of the full length and processed forms of HIPK2 are indicated. Lower: quantitative analysis of Western blot signal intensities from the full-length HIPK2 bands using Quantity One software (Biorad Inc.). The band intensity for HIPK2 expressed in the absence of p53 was arbitrarily set as 100%. (C) Cells were transfected with p53/HIPK2 or treated with adriamycin as shown, followed by the preparation of cell extracts and incubation with in vitro translated [35S]methionine-labeled HIPK2 at 37°C for 2 or 4 h. Reactions were analyzed by SDS–PAGE and autoradiography. The positions of marker proteins, full-length HIPK2 and the HIPK2* cleavage product are indicated.
Figure 4
Figure 4
Caspase-mediated fragmentation of HIPK2 using in vitro cleavage assays. (A) Radiolabelled HIPK2 was incubated with extracts from p53/HIPK2 expressing or control cells. One aliquot was used for immunoprecipitation (IP) with αFlag antibodies, while isotype matched control antibodies were used for immunoprecipitation of another aliquot. Immunoprecipitates were analyzed by SDS–PAGE and autoradiography. (B) The indicated HIPK2 mutants were radiolabelled by in vitro transcription/translation and incubated for 2 h with extracts from control or adriamycin-treated U2OS cells. Cleavage was analyzed by SDS–PAGE and autoradiography. The positions of marker proteins are given, and cleavage products are highlighted by stars. (C) The indicated HIPK2 variants were produced by in vitro translation and incubated with extracts from control and p53/HIPK2 expressing cells. The reaction was further analyzed as in (B).
Figure 5
Figure 5
Direct involvement of caspase-6 in HIPK2 cleavage. (A) [35S]methionine-labeled HIPK2 was tested for in vitro cleavage in the absence or presence of zVEID-fmk (25 μM) as shown on the displayed autoradiogram. (B) Caspase-6 deficient DT40 cells or control cells were treated with adriamycin as shown. Cell lysates were incubated with radiolabelled HIPK2 for 2 h and analyzed for HIPK2 processing by SDS–PAGE and autoradiography. (C) HIPK2 was incubated for 30 min with 1 U of recombinant caspase-3 and -6, respectively, followed by SDS–PAGE and autoradiography. (D) Each of the recombinant caspases was incubated for the indicated periods with radiolabelled HIPK2 or HIPK2 D977A. Autoradiograms of dried SDS gels are shown. (E) U2OS cells were treated for the indicated periods with adriamycin (0.5 μg/ml) and equal amounts of protein contained in cell extracts were analyzed for the cleavage of caspase-6, PARP and HIPK2 and for the occurrence of p53 and β-actin by Western blotting. (F) H1299 cells were transfected to express the indicated HIPK2 proteins in the presence or absence of p53 as shown. After 30 h, cells were lyzed and extracts were further used for Western blot experiments.
Figure 6
Figure 6
Identification of HIPK2 cleavage sites used in vivo. (A) H1299 cells were transfected with vectors encoding different Flag tagged wild type or aspartic acid to alanin HIPK2 point mutants in the absence or presence of p53 as shown. At 30 h after transfection, cells extracts were prepared and further analyzed by Western blotting. (B) H1299 cells were transfected with vectors encoding Flag tagged HIPK2, HIPK2 DD916/977AA, HIPK2 1–977 or HIPK2 1–916 in the absence or presence of p53. The next day, cells were lyzed and analyzed for HIPK2 processing and migration of the cleavage products as shown.
Figure 7
Figure 7
Functional analysis of HIPK2 cleavage at aspartic acids 916 and 977. (A) At 16 h after transfection of H1299 cells with expression vectors encoding HIPK2 and p53, dishes were gently rocked and the detached and swimming cells showing signs of ongoing apoptosis were collected by centrifugation (lane 2), while the adherent cells (lane 1) were collected after scraping with a rubber. Cell extracts were analyzed by immunoblotting for the phosphorylation of p53 and the processing of HIPK2 as shown. (B) H1299 cells were transfected to express p53 in combination with the HIPK2 noncleavable mutant or vectors encoding HIPK2* or HIPK2** and harvested after 16 or 30 h. Extracts were analyzed for the phosphorylation of p53 and the expression of HIPK2 variants by immunoblotting as shown. (C) H1299 cells were transfected with a luciferase reporter gene controlled by the human bax promoter and a p53 expression vector together with the indicated combinations of vectors encoding HIPK2 DD916/977AA, HIPK2 1–977 or HIPK2 1–916. Upper: Luciferase activity was analyzed 16 and 30 h after transfection, gene induction by p53 alone was arbitrarily set as 1. Lower: Cell extracts were analyzed for the occurrence of p53 and HIPK2 as shown. (D) HCT116 cells were transfected with empty vector or plasmids encoding noncleavable HIPK2 or HIPK2 1–916 as shown, followed by the extraction of RNA and subsequent real time PCR or alternatively RT–PCR for Bax and GAPDH. Upper: Quantification of normalized Bax mRNA expression, fold induction relative to pcDNA3 transfected cells is shown. Error bars show standard deviations from two independent experiments performed in triplicate. Lower: The ethidium bromide-stained agarose gel shows the products of the RT–PCR, the Western blot in the lower part ensures correct and comparable expression of HIPK2 variants.
Figure 8
Figure 8
Functional analysis of apoptotic HIPK2* and HIPK2** activities. (A) H1299 cells were transfected with the indicated combinations of p53 and HIPK2 or HIPK2 DD916/977AA and analyzed for apoptosis after 16 and 30 h. Error bars show standard deviations. (B) HCT116 cells were transfected to express the indicated HIPK2 variants. The next day, cells were exposed for 24 h to adriamycin as shown. Cell extracts were analyzed by immunoblotting for HIPK2 processing and p53 accumulation. (C) HCT116 cells transfected to express the indicated HIPK2 proteins were treated for 16 or 30 h with adriamycin and then assayed for apoptosis, bars show standard deviations obtained from several independent experiments. Control blots ensured adequate expression of HIPK2 proteins and p53 induction. (D) Schematic diagram illustrating the pathways mediating p53 phosphorylation and activation, HIPK2 cleavage and apoptosis induction.

References

    1. Berger M, Stahl N, Del Sal G, Haupt Y (2005) Mutations in proline 82 of p53 impair its activation by Pin1 and Chk2 in response to DNA damage. Mol Cell Biol 25: 5380–5388 - PMC - PubMed
    1. Brummelkamp TR, Bernards R, Agami R (2002) A system for stable expression of short interfering RNAs in mammalian cells. Science 296: 550–553 - PubMed
    1. Chehab NH, Malikzay A, Stavridi ES, Halazonetis TD (1999) Phosphorylation of Ser-20 mediates stabilization of human p53 in response to DNA damage. Proc Natl Acad Sci USA 96: 13777–13782 - PMC - PubMed
    1. D'Orazi G, Cecchinelli B, Bruno T, Manni I, Higashimoto Y, Saito S, Gostissa M, Coen S, Marchetti A, Del Sal G, Piaggio G, Fanciulli M, Appella E, Soddu S (2002) Homeodomain-interacting protein kinase-2 phosphorylates p53 at Ser 46 and mediates apoptosis. Nat Cell Biol 4: 11–19 - PubMed
    1. de Souza PM, Kankaanranta H, Michael A, Barnes PJ, Giembycz MA, Lindsay MA (2002) Caspase-catalyzed cleavage and activation of Mst1 correlates with eosinophil but not neutrophil apoptosis. Blood 99: 3432–3438 - PubMed

Publication types

MeSH terms