

Autologous morphogen gradients by subtle interstitial flow and matrix interactions
- PMID: 16603487
- PMCID: PMC1479084
- DOI: 10.1529/biophysj.105.080192
Autologous morphogen gradients by subtle interstitial flow and matrix interactions
Abstract
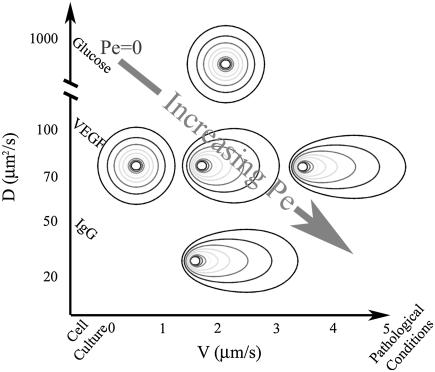
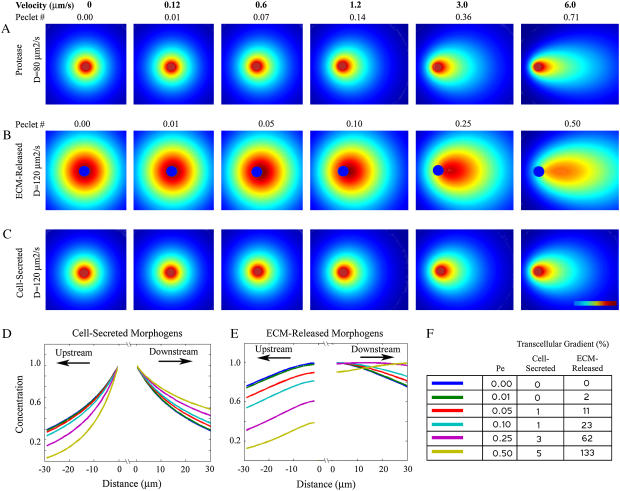
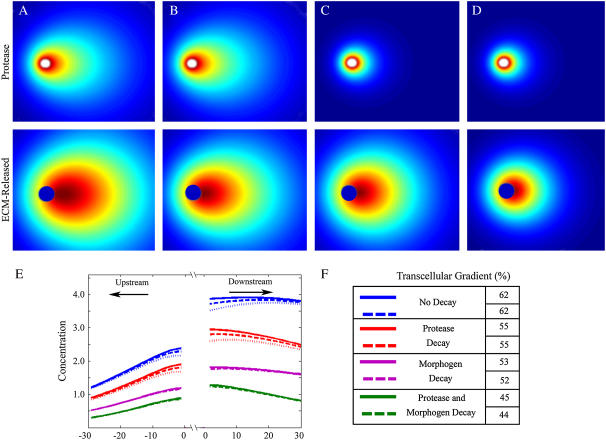
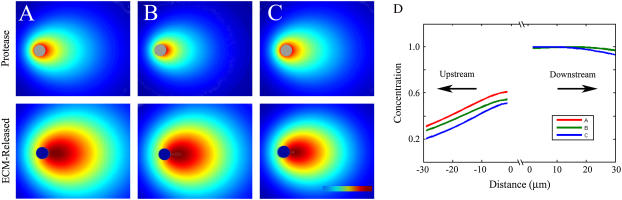
Cell response to extracellular cues is often driven by gradients of morphogenetic and chemotactic proteins, and therefore descriptions of how such gradients arise are critical to understanding and manipulating these processes. Many of these proteins are secreted in matrix-binding form to be subsequently released proteolytically, and here we explore how this feature, along with small dynamic forces that are present in all tissues, can affect pericellular protein gradients. We demonstrate that 1), pericellular gradients of cell-secreted proteins can be greatly amplified when secreted by the cell in matrix-binding form as compared to a nonmatrix-interacting form; and 2), subtle flows can drive significant asymmetry in pericellular protein concentrations and create transcellular gradients that increase in the direction of flow. This study thus demonstrates how convection and matrix-binding, both physiological characteristics, combine to allow cells to create their own autologous chemotactic gradients that may drive, for example, tumor cells and immune cells into draining lymphatic capillaries.
Figures
Similar articles
-
A driving force for change: interstitial flow as a morphoregulator.Trends Cell Biol. 2007 Jan;17(1):44-50. doi: 10.1016/j.tcb.2006.11.007. Epub 2006 Dec 1. Trends Cell Biol. 2007. PMID: 17141502 Review.
-
Synergy between interstitial flow and VEGF directs capillary morphogenesis in vitro through a gradient amplification mechanism.Proc Natl Acad Sci U S A. 2005 Nov 1;102(44):15779-84. doi: 10.1073/pnas.0503681102. Epub 2005 Oct 25. Proc Natl Acad Sci U S A. 2005. PMID: 16249343 Free PMC article.
-
Signaling in morphogenesis: transport cues in morphogenesis.Curr Opin Biotechnol. 2003 Oct;14(5):547-50. doi: 10.1016/j.copbio.2003.09.003. Curr Opin Biotechnol. 2003. PMID: 14580587 Review.
-
Study of the influence of fibrous pericellular matrix in the cortical interstitial fluid movement with hydroelectrochemical effects.J Biomech Eng. 2008 Feb;130(1):011001. doi: 10.1115/1.2838025. J Biomech Eng. 2008. PMID: 18298177
-
Enhanced cancer cell invasion caused by fibroblasts when fluid flow is present.Biomech Model Mechanobiol. 2019 Aug;18(4):1047-1078. doi: 10.1007/s10237-019-01128-2. Epub 2019 Feb 22. Biomech Model Mechanobiol. 2019. PMID: 30796640
Cited by
-
Perspective: Flicking with flow: Can microfluidics revolutionize the cancer research?Biomicrofluidics. 2013 Jan 31;7(1):11811. doi: 10.1063/1.4789750. eCollection 2013. Biomicrofluidics. 2013. PMID: 24403993 Free PMC article.
-
The CCL2-CCR2 astrocyte-cancer cell axis in tumor extravasation at the brain.Sci Adv. 2021 Jun 23;7(26):eabg8139. doi: 10.1126/sciadv.abg8139. Print 2021 Jun. Sci Adv. 2021. PMID: 34162553 Free PMC article.
-
Deconstructing signaling in three dimensions.Biochemistry. 2014 Apr 8;53(13):2078-90. doi: 10.1021/bi401710d. Epub 2014 Mar 28. Biochemistry. 2014. PMID: 24649923 Free PMC article. Review.
-
Collagen I hydrogel microstructure and composition conjointly regulate vascular network formation.Acta Biomater. 2016 Oct 15;44:200-8. doi: 10.1016/j.actbio.2016.08.028. Epub 2016 Aug 18. Acta Biomater. 2016. PMID: 27545811 Free PMC article.
-
The Biophysics of Lymphatic Transport: Engineering Tools and Immunological Consequences.iScience. 2019 Dec 20;22:28-43. doi: 10.1016/j.isci.2019.11.005. Epub 2019 Nov 6. iScience. 2019. PMID: 31739172 Free PMC article. Review.
References
-
- Gurdon, J. B., and P. Y. Bourillot. 2001. Morphogen gradient interpretation. Nature. 413:797–803. - PubMed
-
- Manes, S., C. Gomez-Mouton, R. A. Lacalle, S. Jimenez-Baranda, E. Mira, and C. Martinez-A. 2005. Mastering time and space: immune cell polarization and chemotaxis. Semin. Immunol. 17:77–86. - PubMed
-
- Turing, A. M. 1952. The chemical basis of morphogenesis. Philos. Trans. R. Soc. Lond. B. 237:37–72.
Publication types
MeSH terms
Substances
Grants and funding
LinkOut - more resources
Full Text Sources
Other Literature Sources
