Flexible histone tails in a new mesoscopic oligonucleosome model
- PMID: 16603492
- PMCID: PMC1479056
- DOI: 10.1529/biophysj.106.083006
Flexible histone tails in a new mesoscopic oligonucleosome model
Abstract
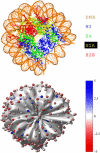
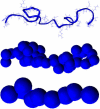
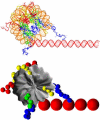
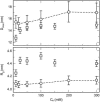
We describe a new mesoscopic model of oligonucleosomes that incorporates flexible histone tails. The nucleosome cores are modeled using the discrete surface-charge optimization model, which treats the nucleosome as an electrostatic surface represented by hundreds of point charges; the linker DNAs are treated using a discrete elastic chain model; and the histone tails are modeled using a bead/chain hydrodynamic approach as chains of connected beads where each bead represents five protein residues. Appropriate charges and force fields are assigned to each histone chain so as to reproduce the electrostatic potential, structure, and dynamics of the corresponding atomistic histone tails at different salt conditions. The dynamics of resulting oligonucleosomes at different sizes and varying salt concentrations are simulated by Brownian dynamics with complete hydrodynamic interactions. The analyses demonstrate that the new mesoscopic model reproduces experimental results better than its predecessors, which modeled histone tails as rigid entities. In particular, our model with flexible histone tails: correctly accounts for salt-dependent conformational changes in the histone tails; yields the experimentally obtained values of histone-tail mediated core/core attraction energies; and considers the partial shielding of electrostatic repulsion between DNA linkers as a result of the spatial distribution of histone tails. These effects are crucial for regulating chromatin structure but are absent or improperly treated in models with rigid histone tails. The development of this model of oligonucleosomes thus opens new avenues for studying the role of histone tails and their variants in mediating gene expression through modulation of chromatin structure.
Figures





Similar articles
-
Role of histone tails in chromatin folding revealed by a mesoscopic oligonucleosome model.Proc Natl Acad Sci U S A. 2006 Oct 31;103(44):16236-41. doi: 10.1073/pnas.0604817103. Epub 2006 Oct 23. Proc Natl Acad Sci U S A. 2006. PMID: 17060627 Free PMC article.
-
Computer modeling demonstrates that electrostatic attraction of nucleosomal DNA is mediated by histone tails.Biophys J. 2006 Jun 15;90(12):4305-16. doi: 10.1529/biophysj.105.080226. Epub 2006 Mar 24. Biophys J. 2006. PMID: 16565063 Free PMC article.
-
A tale of tails: how histone tails mediate chromatin compaction in different salt and linker histone environments.J Phys Chem A. 2009 Apr 23;113(16):4045-59. doi: 10.1021/jp810375d. J Phys Chem A. 2009. PMID: 19298048 Free PMC article.
-
Breaths, Twists, and Turns of Atomistic Nucleosomes.J Mol Biol. 2021 Mar 19;433(6):166744. doi: 10.1016/j.jmb.2020.166744. Epub 2020 Dec 10. J Mol Biol. 2021. PMID: 33309853 Review.
-
Secondary structures of the core histone N-terminal tails: their role in regulating chromatin structure.Subcell Biochem. 2013;61:37-55. doi: 10.1007/978-94-007-4525-4_2. Subcell Biochem. 2013. PMID: 23150245 Review.
Cited by
-
Determining mesoscale chromatin structure parameters from spatially correlated cleavage data using a coarse-grained oligonucleosome model.bioRxiv [Preprint]. 2024 Jul 29:2024.07.28.605011. doi: 10.1101/2024.07.28.605011. bioRxiv. 2024. PMID: 39131347 Free PMC article. Preprint.
-
Mechanism of DNA origami folding elucidated by mesoscopic simulations.Nat Commun. 2024 Apr 8;15(1):3015. doi: 10.1038/s41467-024-46998-y. Nat Commun. 2024. PMID: 38589344 Free PMC article.
-
Evaluation of ion binding to DNA duplexes using a size-modified Poisson-Boltzmann theory.Biophys J. 2007 Nov 1;93(9):3202-9. doi: 10.1529/biophysj.106.099168. Epub 2007 Jun 29. Biophys J. 2007. PMID: 17604318 Free PMC article.
-
Chromatin Fiber Folding Directed by Cooperative Histone Tail Acetylation and Linker Histone Binding.Biophys J. 2018 May 22;114(10):2376-2385. doi: 10.1016/j.bpj.2018.03.008. Epub 2018 Apr 11. Biophys J. 2018. PMID: 29655483 Free PMC article.
-
Evidence for heteromorphic chromatin fibers from analysis of nucleosome interactions.Proc Natl Acad Sci U S A. 2009 Aug 11;106(32):13317-22. doi: 10.1073/pnas.0903280106. Epub 2009 Jul 27. Proc Natl Acad Sci U S A. 2009. PMID: 19651606 Free PMC article.
References
-
- Felsenfeld, G., and M. Groudine. 2003. Controlling the double helix. Nature. 421:448–453. - PubMed
-
- Luger, K., A. W. Mader, R. K. Richmond, D. F. Sargent, and T. J. Richmond. 1997. Crystal structure of the nucleosome core particle at 2.8 Å resolution. Nature. 389:251–260. - PubMed
-
- Davey, C. A., D. F. Sargent, K. Luger, A. W. Maeder, and T. J. Richmond. 2002. Solvent-mediated interactions in the structure of the nucleosome core particle at 1.9 Å resolution. J. Mol. Biol. 319:1097–1113. - PubMed
-
- Richmond, T. J., and C. A. Davey. 2003. The structure of DNA in the nucleosome core. Nature. 423:145–150. - PubMed
-
- Widom, J., and A. Klug. 1985. Structure of the 300 Å chromatin filament: x-ray-diffraction from oriented samples. Cell. 43:207–213. - PubMed
Publication types
MeSH terms
Substances
Grants and funding
LinkOut - more resources
Full Text Sources

