The kinetics of nucleated polymerizations at high concentrations: amyloid fibril formation near and above the "supercritical concentration"
- PMID: 16603497
- PMCID: PMC1479066
- DOI: 10.1529/biophysj.105.073767
The kinetics of nucleated polymerizations at high concentrations: amyloid fibril formation near and above the "supercritical concentration"
Abstract
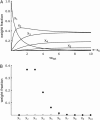
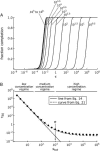
The formation of amyloid and other types of protein fibrils is thought to proceed by a nucleated polymerization mechanism. One of the most important features commonly associated with nucleated polymerizations is a strong dependence of the rate on the concentration. However, the dependence of fibril formation rates on concentration can weaken and nearly disappear as the concentration increases. Using numerical solutions to the rate equations for nucleated polymerization and analytical solutions to some limiting cases, we examine this phenomenon and show that it is caused by the concentration approaching and then exceeding the equilibrium constant for dissociation of monomers from species smaller than the nucleus, a quantity we have named the "supercritical concentration". When the concentration exceeds the supercritical concentration, the monomer, not the nucleus, is the highest-energy species on the fibril formation pathway, and the fibril formation reaction behaves initially like an irreversible polymerization. We also derive a relation that can be used in a straightforward method for determining the nucleus size and the supercritical concentration from experimental measurements of fibril formation rates.
Figures


Similar articles
-
Stop-and-go kinetics in amyloid fibrillation.Phys Rev E Stat Nonlin Soft Matter Phys. 2010 Jul;82(1 Pt 1):010901. doi: 10.1103/PhysRevE.82.010901. Epub 2010 Jul 1. Phys Rev E Stat Nonlin Soft Matter Phys. 2010. PMID: 20866557
-
Early stages of amyloid fibril formation studied by liquid-state NMR: the peptide hormone glucagon.Biophys J. 2008 Jul;95(1):366-77. doi: 10.1529/biophysj.107.122895. Epub 2008 Mar 13. Biophys J. 2008. PMID: 18339765 Free PMC article.
-
The mechanism of amyloid spherulite formation by bovine insulin.Biophys J. 2005 Mar;88(3):2013-21. doi: 10.1529/biophysj.104.051896. Epub 2004 Dec 13. Biophys J. 2005. PMID: 15596515 Free PMC article.
-
The growth of amyloid fibrils: rates and mechanisms.Biochem J. 2019 Oct 15;476(19):2677-2703. doi: 10.1042/BCJ20160868. Biochem J. 2019. PMID: 31654060 Review.
-
Basic Equations in Statics and Kinetics of Protein Polymerization and the Mechanism of the Formation and Dissociation of Amyloid Fibrils Revealed by Pressure Perturbation.Subcell Biochem. 2015;72:279-99. doi: 10.1007/978-94-017-9918-8_14. Subcell Biochem. 2015. PMID: 26174387 Review.
Cited by
-
Natural compounds may open new routes to treatment of amyloid diseases.Neurotherapeutics. 2013 Jul;10(3):429-39. doi: 10.1007/s13311-013-0192-7. Neurotherapeutics. 2013. PMID: 23670234 Free PMC article. Review.
-
Fluorescence correlation spectroscopy shows that monomeric polyglutamine molecules form collapsed structures in aqueous solutions.Proc Natl Acad Sci U S A. 2006 Nov 7;103(45):16764-9. doi: 10.1073/pnas.0608175103. Epub 2006 Oct 30. Proc Natl Acad Sci U S A. 2006. PMID: 17075061 Free PMC article.
-
Analysis tools for single-monomer measurements of self-assembly processes.Sci Rep. 2022 Mar 18;12(1):4682. doi: 10.1038/s41598-022-08245-6. Sci Rep. 2022. PMID: 35304498 Free PMC article.
-
The major TMEM106B dementia risk allele affects TMEM106B protein levels and myelin lipid homeostasis in the ageing human hippocampus.Res Sq [Preprint]. 2023 Jan 17:rs.3.rs-2392941. doi: 10.21203/rs.3.rs-2392941/v1. Res Sq. 2023. Update in: Mol Neurodegener. 2023 Sep 19;18(1):63. doi: 10.1186/s13024-023-00650-3. PMID: 36711721 Free PMC article. Updated. Preprint.
-
Model discrimination and mechanistic interpretation of kinetic data in protein aggregation studies.Biophys J. 2009 Apr 8;96(7):2871-87. doi: 10.1016/j.bpj.2008.12.3903. Biophys J. 2009. PMID: 19348769 Free PMC article.
References
-
- Sipe, J. D. 1994. Amyloidosis. Crit. Rev. Clin. Lab. Sci. 31:325–354. - PubMed
-
- Sipe, J. D., and A. S. Cohen. 2000. Review: history of the amyloid fibril. J. Struct. Biol. 130:88–98. - PubMed
-
- Selkoe, D. J. 2003. Folding proteins in fatal ways. Nature. 426:900–904. - PubMed
-
- Dobson, C. M. 2003. Protein folding and misfolding. Nature. 426:884–890. - PubMed
-
- Jarrett, J. T., and P. T. Lansbury. 1993. Seeding one-dimensional crystallization of amyloid: a pathogenic mechanism in Alzheimer's disease and scrapie. Cell. 73:1055–1058. - PubMed
MeSH terms
Substances
LinkOut - more resources
Full Text Sources

