. 2006 May;18(5):1274-91.
doi: 10.1105/tpc.105.034041. Epub 2006 Apr 7.

PH4 of Petunia is an R2R3 MYB protein that activates vacuolar acidification through interactions with basic-helix-loop-helix transcription factors of the anthocyanin pathway

Affiliations

PH4 of Petunia is an R2R3 MYB protein that activates vacuolar acidification through interactions with basic-helix-loop-helix transcription factors of the anthocyanin pathway

Francesca Quattrocchio et al. Plant Cell. 2006 May.

Abstract

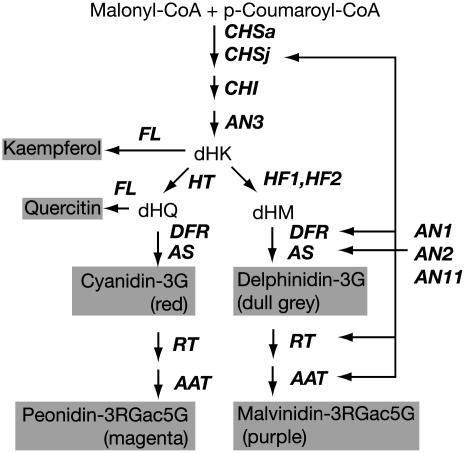
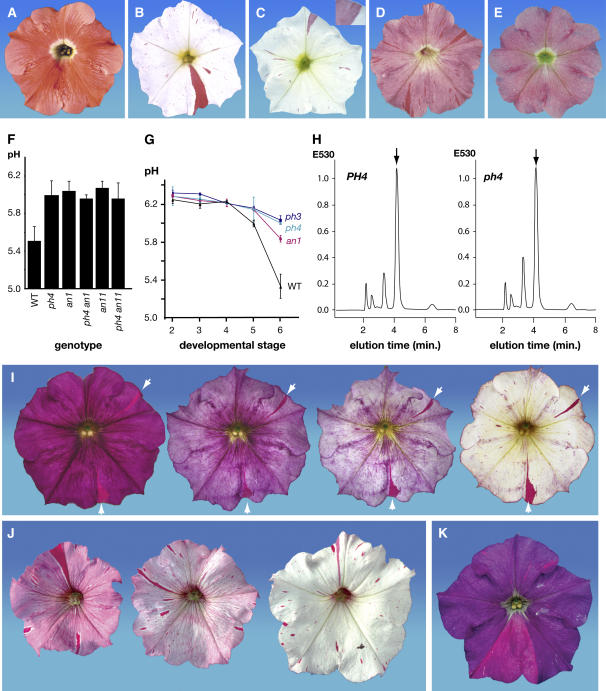
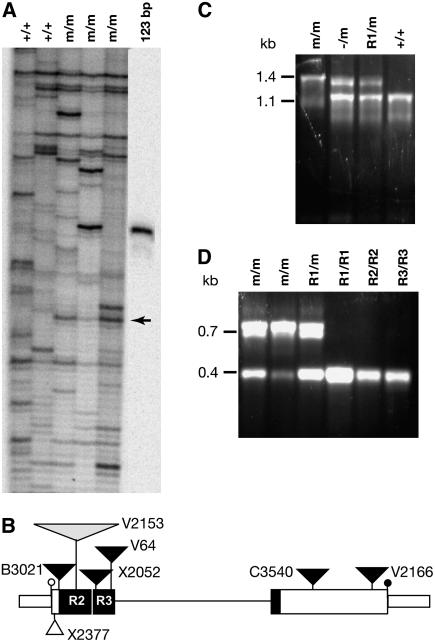
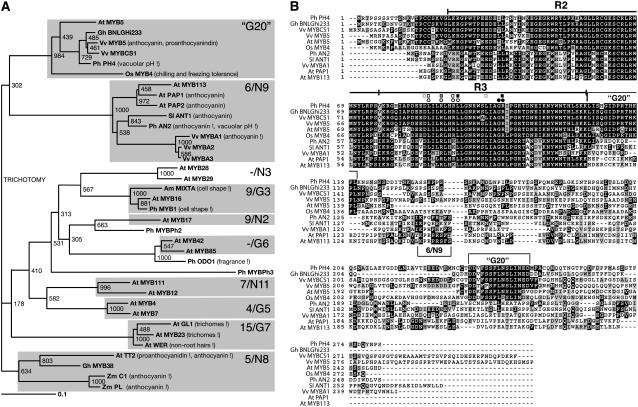
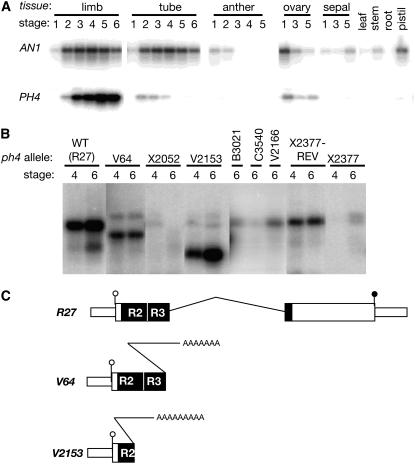
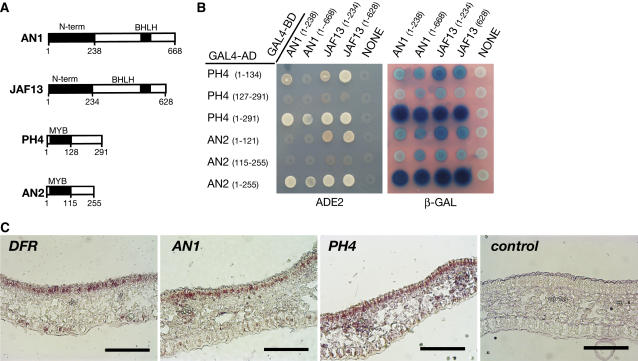
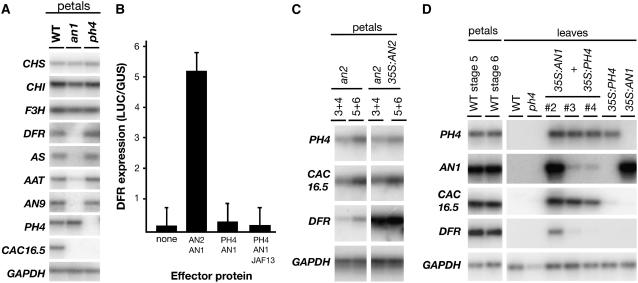
The Petunia hybrida genes ANTHOCYANIN1 (AN1) and AN2 encode transcription factors with a basic-helix-loop-helix (BHLH) and a MYB domain, respectively, that are required for anthocyanin synthesis and acidification of the vacuole in petal cells. Mutation of PH4 results in a bluer flower color, increased pH of petal extracts, and, in certain genetic backgrounds, the disappearance of anthocyanins and fading of the flower color. PH4 encodes a MYB domain protein that is expressed in the petal epidermis and that can interact, like AN2, with AN1 and the related BHLH protein JAF13 in yeast two-hybrid assays. Mutation of PH4 has little or no effect on the expression of structural anthocyanin genes but strongly downregulates the expression of CAC16.5, encoding a protease-like protein of unknown biological function. Constitutive expression of PH4 and AN1 in transgenic plants is sufficient to activate CAC16.5 ectopically. Together with the previous finding that AN1 domains required for anthocyanin synthesis and vacuolar acidification can be partially separated, this suggests that AN1 activates different pathways through interactions with distinct MYB proteins.


Figures

Figure 1.
Figure 1.
Genetic Control of the Anthocyanin Pathway in Petunia Petals. The main anthocyanins and flavonols (gray boxes) are synthesized via a branched pathway. Genes that control distinct steps are indicated in boldface italics. Malonyl-CoA and p-coumaroyl-CoA are converted by the enzymes CHALCONE SYNTHASE (expressed from two distinct genes, CHSa and CHSj), CHALCONE ISOMERASE (encoded by CHIa), and FLAVONOID 3 HYDROXYLASE (encoded by AN3) into dihydrokaempferol (dHK). Hydroxylation of dHK on the 3′ or the 3′ plus 5′ position is controlled by HT (for HYDROXYLATION AT THREE) and the homologs HF1 and HF2 (for HYDROXYLATION AT FIVE) to yield dihydroquercitin (dHQ) and dihydromyricitin (dHM), respectively. The simplest anthocyanins in petunia flowers are 3-glucosides (3G). Through the action of RT (for RHAMNOSYLATION AT FIVE) and AAT (for ANTHOCYANIN-RUTINOSIDE ACYLTRANSFERASE) and others, anthocyanins with a 3-rutinoside p-coumaroyl-5-glucoside (3RGac5G) substitution pattern are generated. The colors displayed by the various anthocyanins (in a fl PH background) are shown in parentheses.
Figure 2.
Figure 2.
Phenotypic Analysis of Flower Pigmentation Mutants. (A) Flower of the wild-type line R27 (AN1, AN11, PH4). (B) Flower of the line W137 (an11-W137, PH4) showing AN11-R revertant sectors, resulting from excisions of dTPH1, on a white (an11-W137) background. (C) Flower homozygous for the unstable alleles an11-W137 and ph4-B3021. Reversion of an11-W137 results in spots with a purplish color rather than red, as a result of the ph4-B3021 mutation. Somatic reversions of ph4-B3021 can be seen occasionally as red (PH4-R) spots within the purplish ph4-B3021 sectors (inset). (D) Flower of line R154 harboring the unstable ph4-V2166 allele in an AN1-R AN11-R background. Note the red PH4 revertant sectors on the purplish ph4 background. (E) Flower of line R149 harboring the stable recessive ph4-V2153 allele in an AN1-R AN11-R genetic background. (F) pH values (means ± sd; n = 7) of petal homogenates of different genotypes in the R27 genetic background. Note that the absolute pH values that are measured show some variation in time, possibly in response to variable environmental conditions in the greenhouse, although the differences between mutants and the wild type are virtually constant. (G) Petal homogenate pH (means ± sd; n = 5) during flower development in wild-type, an1, ph3, and ph4 petals. Developmental stages were defined as follows: stage 2, 30- to 35-mm buds; stage 3, 35- to 45-mm buds; stage 4, buds of maximum size (45 to 50 mm); stage 5, unfolding flowers; stage 6, fully open flowers around anthesis. (H) HPLC analysis of methanol-extractable anthocyanins in petals of stage 4 flower buds from lines R27 (PH4) and R149 (ph4-V2153). The arrows denote the retention time of cyanidin 3-glucoside. (I) Phenotype of ph4-V2166/ph4-V64 flowers in a background that allows the synthesis of 3RGac5G-substituted anthocyanins, resulting from the cross R149 × V64, showing subsequent stages (from left to right) of flower color fading. Note that the blue-violet ph4 cells fade, whereas the red-violet PH4 revertant sectors (white arrows) do not. (J) Phenotype of an1-G621/an1-W138 flowers in a background that synthesizes 3RGac5G-substituted anthocyanins, showing subsequent stages (from left to right) of flower color fading. Note that mutant (an1-G621) tissues fade, whereas full AN1 revertant sectors (mostly originating from excisions of dTPH1 from an1-W138) do not fade. (K) Phenotype of a mature ph2-A2414 flower (comparable to the rightmost flowers in [I] and [J]) in a background (R160 × V26) that synthesizes 3RGac5G-substituted anthocyanins. Note that neither the PH2 tissue (red-violet sectors) nor the ph2 tissue (blue-violet background) displays fading.
Figure 3.
Figure 3.
Molecular Analysis of PH4. (A) Transposon display analysis of plants homozygous for the parental wild type (+/+) or the mutable ph4-B3021 allele (m/m). The rightmost lane contains a radiolabeled 123-bp size marker. The arrow indicates a fragment derived from PH4. (B) Map of the PH4 gene and mutant alleles. Boxes represent exons, and the thin line represents an intron. Protein-coding regions are indicated by double height, and the region encoding the R2 and R3 repeats of the MYB domain is filled in black. The open and closed circles represent the start and stop codons, respectively. The triangles indicate transposon insertions in the indicated alleles: the large open triangle represents TPH6, the mid-size closed triangles represent dTPH1, and the small open triangle represents dTPH7. (C) PCR analysis of plants harboring ph4-B3021 and derived stable ph4 alleles. + indicates the parental wild-type allele, m indicates the mutable ph4-B3021 allele, R1 indicates a derived revertant allele, and – indicates a stable recessive ph4 allele. The primers used were 583 and 1060 (Table 1). (D) PCR analysis of plants harboring ph4-V2166 and derived germinal revertant alleles. m represents the mutable ph4-V2166 allele, and R1, R2, and R3 represent three independently isolated revertant alleles. The primers used were 690 and 582.
Figure 4.
Figure 4.
Similarity of PH4 to Other MYB Proteins. (A) Phylogenetic tree displaying the similarity of PH4 to other R2R3 MYB proteins. The tree was based on an alignment of the 104 amino acids spanning the MYB domain (see Supplemental Figure 2 online). Names of the various proteins are given in boldface uppercase letters, and their origin is indicated by a two-letter prefix: Am is Antirrhinum, Ph is petunia, At is Arabidopsis, Zm is maize, Sl is tomato, Vv is grape, and Gh is cotton. The function of some of the proteins is given in parentheses and, if substantiated by a loss-of-function phenotype, an exclamation point. The gray boxes indicate representatives of subgroups of related R2R3 MYB proteins defined previously (Stracke et al., 2001; Jiang et al., 2004); proteins in subgroups with G numbers share conserved sequences in their C termini, whereas proteins in subgroups with N numbers do not (Jiang et al., 2004). Because R2R3 MYBs from the PH4 subgroup share sequence similarity in their C termini, they are classified as a new G subgroup that we tentatively labeled “G20.” Numbers at branch points indicate bootstrap support (1000 replicates). (B) Alignment of PH4 to R2R3 MYB proteins of subgroups N9 and G20. Identical amino acids are indicated in black, similar amino acids in gray. Dashes represent gaps introduced to improve the alignment. The R2 and R3 repeats that make up the MYB domain are indicated above the alignment. Regions in the C-terminal domains that are conserved between members of the N9 and G20 subgroups are boxed. Amino acids homologous with residues in maize C1 that are required for physical interaction with R and for R-dependent transcriptional activation (Grotewold et al., 2000) are indicated above the sequence with white and black circles, respectively. Amino acids in Arabidopsis TT2 that are involved in the interaction with a BHLH partner and/or the activation of the DFR promoter (Zimmermann et al., 2004) are indicated with squares: residues with strong effect on TT2 activity when mutated are indicated by black squares, and those with mild or small effect are indicated by gray and white squares.
Figure 5.
Figure 5.
Expression Analysis of PH4. (A) RT-PCR analysis of PH4 and AN1 mRNAs from organs (petal limbs, petal tubes, anthers, ovaries, and sepals) of flowers of different developmental stages (1 to 6) and from leaves, roots, stems, and stigma plus style. (B) 3′RACE analysis of mRNAs expressed from mutant ph4 alleles. RNA was isolated from petals of stages 4 and 6 flowers homozygous for different ph4 alleles, as indicated above the lanes. RT products were amplified with a primer complementary to the 5′ untranslated mRNA region immediately upstream of the start codon (primer 1107) and the poly(A) tail. (C) Structure of mutant ph4 mRNAs. The exons and protein-coding regions are drawn as in Figure 3B. The half-triangles with poly(A) at the 3′ ends of ph4-V64 and ph4-V2153 mRNAs denote dTPH6 and dTPH1 sequences, respectively.
Figure 6.
Figure 6.
Interactions between PH4 and Regulators of the Anthocyanin Pathway. (A) Diagrams of the proteins showing the positions of conserved domains (black) used for the two-hybrid analysis. The numbers below each map indicate the positions of amino acid residues. (B) Yeast two-hybrid analysis. Different combinations of plasmids expressing fusion proteins (as indicated at left and at bottom of the grids) were cotransformed in yeast, spotted on a plate, and assayed for simultaneous activation of the HIS and ADE reporter genes (seen as His- and adenine-independent growth; left panel) or the LACz reporter gene (seen as bluing in an X-Gal overlay assay; right panel). (C) In situ localization of AN1, PH4, and DFR mRNAs in the petal limb, detected by hybridization with antisense RNA probes. As a negative control, sections were hybridized with a sense strand of DFR (control). Sections are depicted with the adaxial epidermis at the top. Bars = 100 μm.
Figure 7.
Figure 7.
Effect of PH4 Function on Gene Expression. (A) RT-PCR analysis of various mRNAs (indicated at left) expressed in petals of the wild type (R27) and stable an1-W225 and ph4-V2153 mutants. (B) Activation of a DFR:GUS reporter gene in transiently transformed leaf cells. The columns and error bars denote means ± sd (n = 8) of DFR:LUC expression after cobombardment with various combinations of 35S:AN1, 35S:AN2, 35S:JAF13, and/or 35S:PH4. DFR:LUC expression (in arbitrary units) was measured as LUC activity and normalized to GUS activity expressed from a cobombarded reference gene (35S:GUS). (C) RT-PCR analysis of mRNAs (indicated at left) expressed in petals of an2 mutants and isogenic transgenic plants in which an2 is complemented by a 35S:AN2 transgene. Petals of closed buds (stage 3+4) and open(ing) flowers (stage 5+6) were analyzed. (D) Gene expression in wild-type, an1, and ph4 petals and leaves of transgenic plants containing 35S:AN1 and/or 35S:PH4. The expression levels of the mRNAs (indicated at left) were determined by RT-PCR. The genotype of each sample is indicated above the lane. Three distinct double transgenic plants (containing 35S:AN1 and 35S:PH4) were analyzed that differ in the strength of 35S:AN1 expression (designated #2, #3, and #4).

Similar articles

Cited by

References

    1. Alfenito, M.R., Souer, E., Goodman, C.D., Buell, R., Mol, J., Koes, R., and Walbot, V. (1998). Functional complementation of anthocyanin sequestration in the vacuole by widely divergent glutathione S-transferases. Plant Cell 10 1135–1149. - PMC - PubMed
    1. Avila, A., Nieto, C., Cañas, L., Benito, J., and Paz-Ares, J. (1993). Petunia hybrida genes related to the maize regulatory C1 gene and to the animal myb proto-oncogenes. Plant J. 3 553–562. - PubMed
    1. Bachem, C.W., van der Hoeven, R.S., de Bruijn, S.M., Vreugdenhil, D., Zabeau, M., and Visser, R.G. (1996). Visualization of differential gene expression using a novel method of RNA fingerprinting based on AFLP: Analysis of gene expression during potato tuber development. Plant J. 9 745–753. - PubMed
    1. Baudry, A., Heim, M.A., Dubreucq, B., Caboche, M., Weisshaar, B., and Lepiniec, L. (2004). TT2, TT8, and TTG1 synergistically specify the expression of BANYULS and proanthocyanidin biosynthesis in Arabidopsis thaliana. Plant J. 39 366–380. - PubMed
    1. Bernhardt, C., Lee, M.M., Gonzalez, A., Zhang, F., Lloyd, A., and Schiefelbein, J. (2003). The bHLH genes GLABRA3 (GL3) and ENHANCER OF GLABRA3 (EGL3) specify epidermal cell fate in the Arabidopsis root. Development 130 6431–6439. - PubMed

Publication types

MeSH terms

Associated data

LinkOut - more resources