. 2006 May;7(5):498-506.
doi: 10.1038/ni1327. Epub 2006 Apr 9.

Osteopontin expression is essential for interferon-alpha production by plasmacytoid dendritic cells

Affiliations

Osteopontin expression is essential for interferon-alpha production by plasmacytoid dendritic cells

Mari L Shinohara et al. Nat Immunol. 2006 May.

Abstract

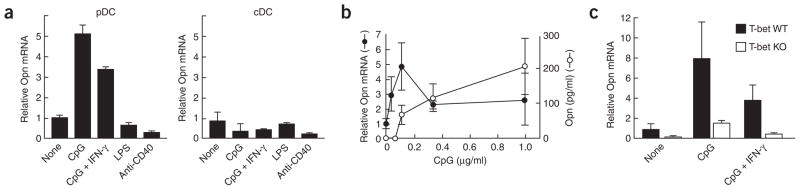
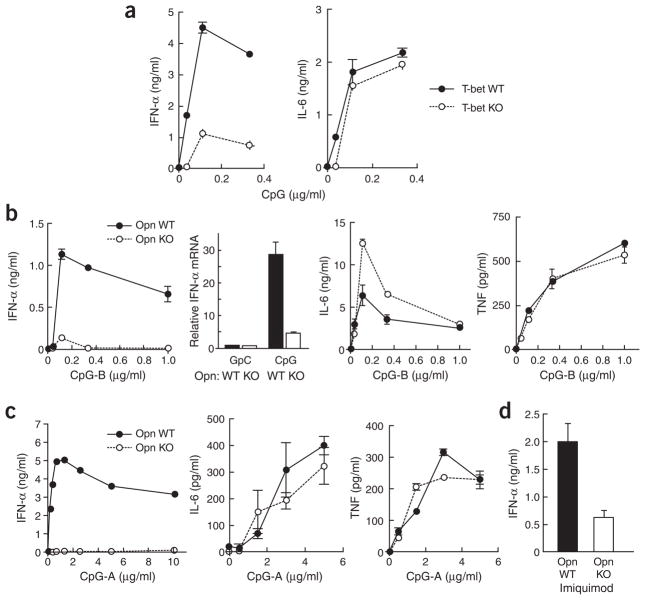
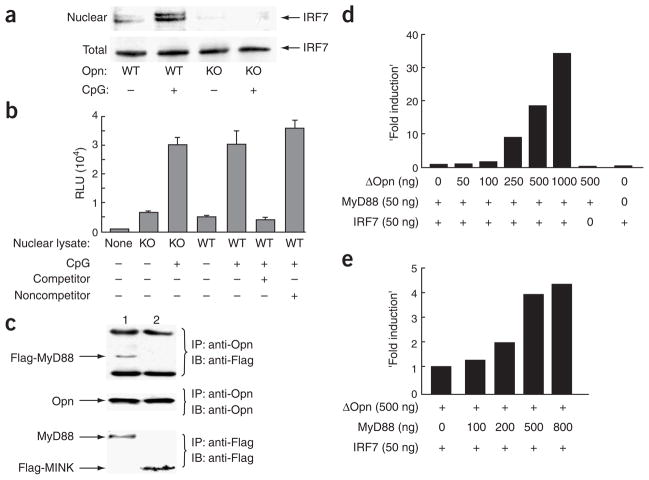
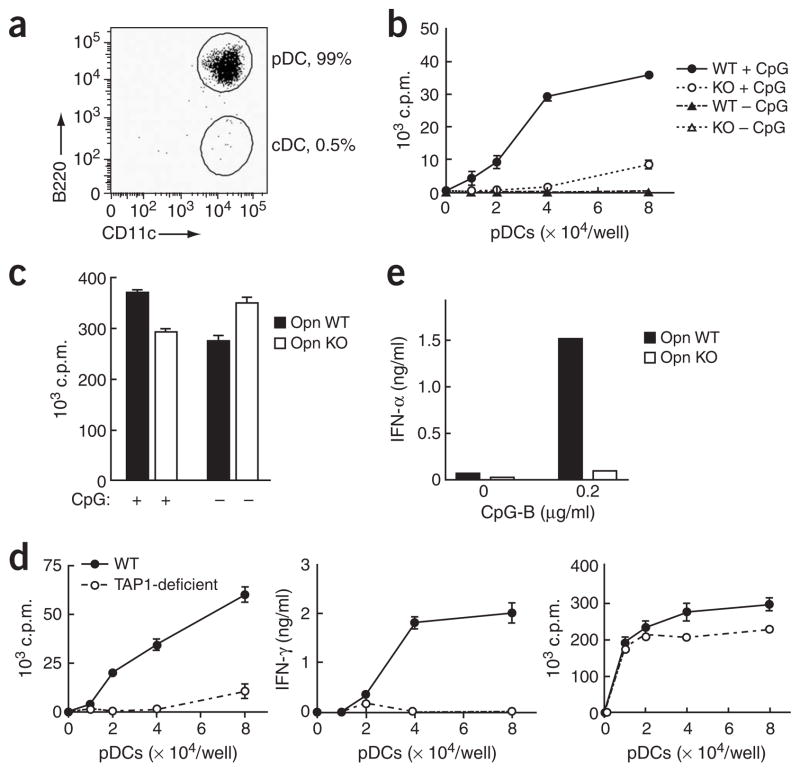
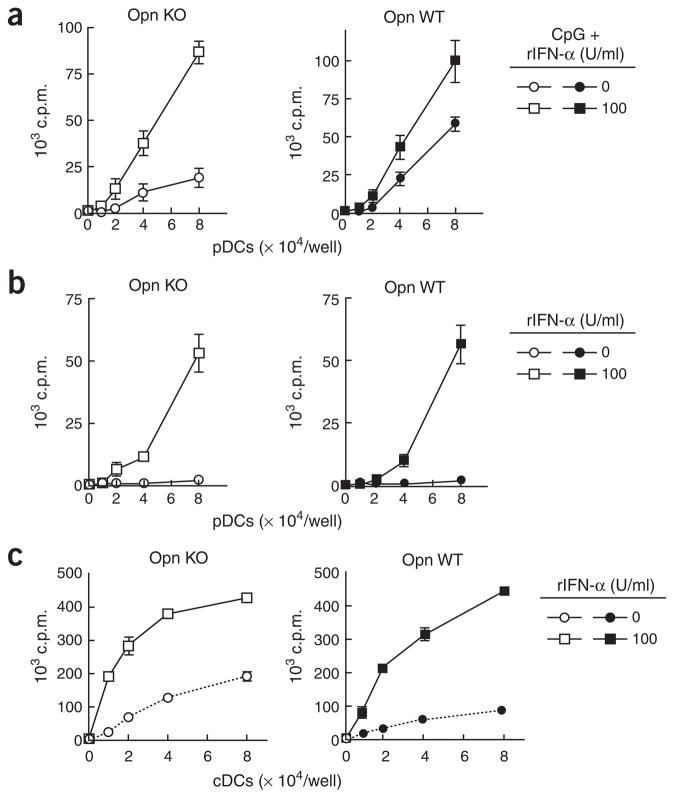
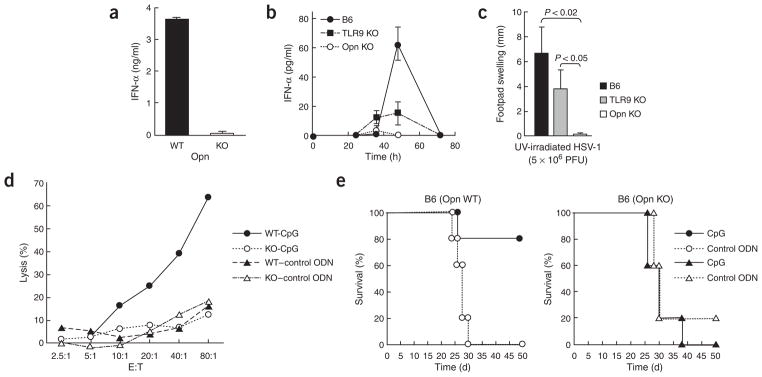
The observation that the T-bet transcription factor allows tissue-specific upregulation of intracellular osteopontin (Opn-i) in plasmacytoid dendritic cells (pDCs) suggests that Opn might contribute to the expression of interferon-alpha (IFN-alpha) in those cells. Here we show that Opn deficiency substantially reduced Toll-like receptor 9 (TLR9)-dependent IFN-alpha responses but spared expression of transcription factor NF-kappaB-dependent proinflammatory cytokines. Shortly after TLR9 engagement, colocalization of Opn-i and the adaptor molecule MyD88 was associated with induction of transcription factor IRF7-dependent IFN-alpha gene expression, whereas deficient expression of Opn-i was associated with defective nuclear translocation of IRF7 in pDCs. The importance of the Opn-IFN-alpha pathway was emphasized by its essential involvement in cross-presentation in vitro and in anti-herpes simplex virus 1 IFN-alpha response in vivo. The finding that Opn-i selectively coupled TLR9 signaling to expression of IFN-alpha but not to that of other proinflammatory cytokines provides new molecular insight into the biology of pDCs.


Conflict of interest statement

COMPETING INTERESTS STATEMENT

The authors declare that they have no competing financial interests.

Figures

Figure 1
Figure 1
Opn expression in pDCs and cDCs 24 h after stimulation. (a) Opn mRNA in splenic pDCs (left) or cDCs (right) stimulated with 1 μg/ml of CpG-B (ODN-1668); 1 μg/ml of CpG-B plus 10 ng/ml of recombinant mouse IFN-γ protein; 1 μg/ml of lipopolysaccharide (LPS); or 5 μg/ml of anti-CD40. Relative Opn mRNA is based on Opn mRNA in pDCs without stimulation. (b) Opn mRNA and secreted protein in pDCs and culture supernatants, respectively. (c) Opn mRNA concentrations in T-bet wild-type (T-bet WT) and T-bet-deficient (T-bet KO) pDCs. Concentrations of CpG-B and recombinant mouse IFN-γ were 1 μg/ml and 10 ng/ml, respectively. Relative Opn mRNA is based on Opn mRNA in T-bet wild-type pDCs without stimulation. Opn mRNA and protein were measured by quantitative real-time PCR of cDNA and ELISA, respectively, with triplicate wells, and are presented with error bars. Data are representative of at least three independent experiments.
Figure 2
Figure 2
Cytokine production by pDCs. (a) IFN-α (left) and IL-6 (right) in 24-hour pDC culture supernatants of T-bet wild-type (T-bet WT) versus T-bet-deficient (T-bet KO) cells stimulated with various concentrations of CpG-B (ODN-1668). The pDCs were plated at a density of 1.0 × 10⁶ cells/ml. (b) Comparison of secreted IFN-α protein, cellular IFN-α mRNA, secreted IL-6 and TNF (left to right) for Opn wild-type (Opn WT) and Opn-deficient (Opn KO) pDCs plated at a density of 1.0 × 10⁶ cells/ml with CpG-B (1 μg/ml for mRNA samples; otherwise, concentrations along horizontal axes) and collected at 24 h. (c) Comparison of secreted IFN-α, IL-6 and TNF (left to right) for Opn wild-type (Opn WT) and Opn-deficient (Opn KO) pDCs after CpG-A stimulation. The pDCs (0.2 × 10⁶ cells/ml) were plated with CpG-A (ODN-D19; concentration, horizontal axis) and were collected at 24 h for analysis. (d) IFN-α from 24-hour pDC culture supernatants (1.0 × 10⁶ cells/ml) from Opn WT and Opn KO mice stimulated with imiquimod (R837). Protein and mRNA were measured by ELISA and real-time PCR in triplicate wells, except for c, for which the IFN-α ELISA was done in duplicate wells. Data are representative of two to three experiments.
Figure 3
Figure 3
Intracellular Opn is required for IFN-α production. (ac) Lentivirus infection of pDCs stimulated with CpG-B (0.2 μg/ml). (a) Extracellular Opn protein measured by ELISA in 6-hour culture supernatants of sorted splenic Opn-deficient pDCs infected with lentivirus to express full-length Opn (fOpn), mutant Opn (ΔOpn) or GFP control (GFP). HIV capsid protein p24, determined by ELISA, indicates the concentration of lentivirus used for infection (horizontal axis). (b) IFN-α in 24-hour culture supernatants of splenic Opn-deficient pDCs transfected with lentiviral reagents (GFP, ΔOpn and fOpn). (c) IFN-α (left vertical axis) or intracellular Opn (right vertical axis) in culture supernatants and cells. ‘Titration’ of mutant Opn lentivirus (ΔOpn-lenti) into bone marrow–derived Opn-deficient pDCs (1 × 10⁶ cells/ml) was followed by CpG-B stimulation (ODN-1668; 0.2 μg/ml), then analysis 24 h later. (d) IFN-α production in 24-hour culture supernatants of Opn wild-type (WT) and Opn-deficient (KO) bone marrow–derived pDCs after a 20-minute pulse with DOTAP in complex with CpG-B (ODN-1668; left) or CpG-A (ODN-D19) with (+) or without (−) DOTAP (right). Data are representative of at least three independent experiments.
Figure 4
Figure 4
Biochemical analysis of Opn-i. (a) Nuclear translocation of IRF7 in total bone marrow–derived Opn wild-type (WT) and Opn-deficient (KO) DCs treated with CpG-B (0.4 μM) for 3 h before extraction of nuclear and total lysates. (b) Activation of NF-κB in total bone marrow–derived DCs stimulated for 1 h with 0.3 μM CpG-B. Control competitor and noncompetitor oligonucleotides were added to some samples (+, below graph) to confirm sequence-specific binding of NF-κB in lysate samples. (c) Immunoblot (IB) of protein complexes immunoprecipitated (IP) from HEK293 cells cotransfected for 48 h with Opn, Flag-MyD88 and TLR9 (lane 1) or Opn, Flag-Mink (serine kinase) and TLR2 (lane 2; negative control) followed by stimulation for 3 h with 0.3 μM CpG-B. (d) Opn expression and Ifna4 activation in HEK293 cells transiently transfected with mutant Opn–expressing lentivirus (concentrations, below graph) along with IRF7 and/or MyD88 cDNA. (e) MyD88-dependent Ifna4 activation after transfection of MyD88 expression vector (concentrations, below graph) into HEK293 cells along with mutant Opn and/or IRF7. Data are representative of at least three independent experiments.
Figure 5
Figure 5
Localization of Opn together with MyD88 and TLR9. (a, b) Immuno-fluorescence and confocal microscopy of Opn (green) and MyD88 (red; a) or TLR9 (red; b) in pDCs. After treatment of pDCs with 0.5 μM of CpG-B for 10 min, cells were fixed and Opn, MyD88 and TLR9 were detected with mouse anti-Opn (2A1), rabbit anti-MyD88 and rabbit anti-TLR9, followed by secondary antibodies. Original magnification, ×400 (first three columns) and ×800 (single-cell images, far right).
Figure 6
Figure 6
In vitro OVA cross-presentation by pDCs. (a) Purity of splenic CD11c+ cells (B220+CD11c+CD3εCD19NK1.1) after repeated sorting by flow cytometry. (b) OVA cross-presentation by Opn wild-type (WT) or Opn Opn-deficient (KO) pDCs. Purified bone marrow–derived pDCs were first cultured for 24 h with (+ CpG) or without (− CpG) 0.2 μg/ml of CpG-B in the presence of soluble OVA (50 μg/ml), then OT-I T cell proliferation was measured. (c) OT-I peptide presentation by Opn WT or Opn KO pDCs. Purified splenic pDCs were cultured for 18 h with (+) or without (−) 0.2 μg/ml of CpG-B in presence of OT-I peptide (1 μg/ml). (d) OVA cross-presentation (left and middle) and OT-I peptide direct presentation (right) by purified splenic pDCs from B6 wild-type mice (WT) and B6 mice deficient in transporter associated with antigen processing (TAP1-deficient). The pDCs were treated for 20 h with 50 μg/ml of OVA or 1 μg/ml of OT-I peptide with 0.2 μg/ml of CpG-B, then OT-I T cell proliferation and IFN-γ production were assessed. (e) IFN-α production by pDCs incubated with OVA and CpG (0.2 μg/ml of CpG-B) before culture together with OT-I T cells. Data are representative of at least four independent experiments.
Figure 7
Figure 7
IFN-α-dependent cross-presentation. (a, b) Purified bone marrow–derived Opn-deficient (Opn KO) and Opn wild-type (Opn WT) pDCs were treated with or without CpG-B (0.2 μg/ml) and/or recombinant IFN-α (rIFN-α; 1 × 10⁸ to 5 × 10⁸ units = 1 mg; key) in the presence of OVA (50 μg/ml). OT-1 T cell proliferation was measured. (a) Supplementary effect of recombinant IFN-α in antigen cross-presentation by CpG-treated pDCs. (b) Treatment with recombinant IFN-α without CpG is sufficient to ‘license’ pDCs for antigen cross-presentation. (c) ‘Licensing’ of cDCs from Opn KO and Opn WT mice after treatment of cells with (100 U/ml; key) or without (0 U/ml; key) recombinant IFN-α. Data are representative of at least three independent experiments.
Figure 8
Figure 8
Opn-dependent in vivo response to HSV-1 infection. (a) IFN-α concentrations from Opn wild-type (WT) and Opn-deficient (KO) pDC culture supernatants after incubation in vitro with ultraviolet irradiation–treated (UV-irradiated) HSV-1 for 24 h. (b) Serum IFN-α in B6, B6 TLR9-deficient (TLR9 KO) and B6 Opn-deficient (Opn KO) mice injected intraperitoneally with HSV-1 (1 × 10⁶ PFU/mouse). Data represent three mice per group. (c) HSV-1-specific delayed-type hypersensitivity responses in B6, TLR9 KO and Opn KO mice injected intraperitoneally with HSV-1 (5 × 10⁶ PFU/mouse) and challenged 6 d later in the left footpad with ultraviolet irradiation–treated HSV-1 (1 × 10⁵ PFU/mouse). Error bars indicate mean ± s.d. of three mice per group. (d) 51Cr-release assay of NK cells from B6 Opn wild-type (WT) and Opn-deficient (KO) mice, evaluated against YAC-1 cells. Draining lymph nodes of mice injected with CpG (ODN-1585; -CpG) or control GpC (–control ODN) were pooled. Data are representative of at least three independent experiments. (e) Survival of Opn WT and Opn KO mice injected intraperitoneally with 5 × 10³ B16 cells plus 100 μg CpG (ODN-1585) or control GpC (control ODN). There were five mice in each group.

Comment in

References

    1. Iwasaki A, Medzhitov R. Toll-like receptor control of the adaptive immune responses. Nat Immunol. 2004;5:987–995. - PubMed
    1. Liu YJ. IPC: professional type 1 interferon-producing cells and plasmacytoid dendritic cell precursors. Annu Rev Immunol. 2005;23:275–306. - PubMed
    1. Krug A, et al. TLR9-dependent recognition of MCMV by IPC and DC generates coordinated cytokine responses that activate antiviral NK cell function. Immunity. 2004;21:107–119. - PubMed
    1. Colonna M, Trinchieri G, Liu YJ. Plasmacytoid dendritic cells in immunity. Nat Immunol. 2004;5:1219–1226. - PubMed
    1. Banchereau J, Pascual V, Palucka AK. Autoimmunity through cytokine-induced dendritic cell activation. Immunity. 2004;20:539–550. - PubMed

Publication types