. 2006 Apr;44(4):202-18.
doi: 10.1002/dvg.20203.

In vivo imaging and differential localization of lipid-modified GFP-variant fusions in embryonic stem cells and mice

Affiliations

In vivo imaging and differential localization of lipid-modified GFP-variant fusions in embryonic stem cells and mice

Jerry M Rhee et al. Genesis. 2006 Apr.

Abstract

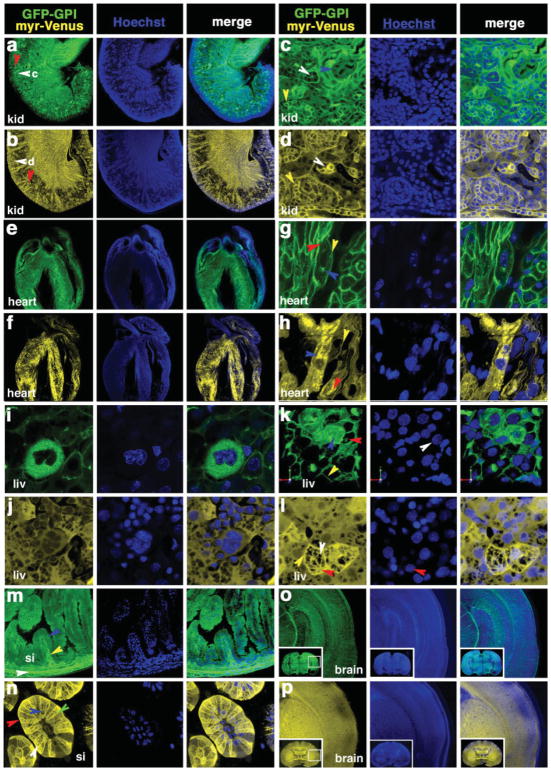
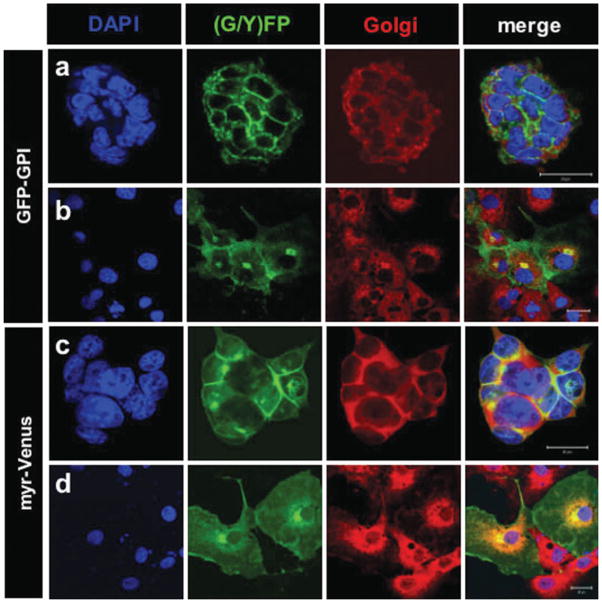
The visualization of live cell behaviors operating in situ combined with the power of mouse genetics represents a major step toward understanding the mechanisms regulating embryonic development, homeostasis, and disease progression in mammals. The availability of genetically encoded fluorescent protein reporters, combined with improved optical imaging modalities, have led to advances in our ability to examine cells in vivo. We developed a series of lipid-modified fluorescent protein fusions that are targeted to and label the secretory pathway and the plasma membrane, and that are amenable for use in mice. Here we report the generation of two strains of mice, each expressing a spectrally distinct lipid-modified GFP-variant fluorescent protein fusion. The CAG::GFP-GPI strain exhibited widespread expression of a glycosylphosphatidylinositol-tagged green fluorescent protein (GFP) fusion, while the CAG::myr-Venus strain exhibited widespread expression of a myristoyl-Venus yellow fluorescent protein fusion. Imaging of live transgenic embryonic stem (ES) cells, either live or fixed embryos and postnatal tissues demonstrated that glycosylphosphatidyl inositol- and myristoyl-tagged GFP-variant fusion proteins are targeted to and serve as markers of the plasma membrane. Moreover, our data suggest that these two lipid-modified protein fusions are dynamically targeted both to overlapping as well as distinct lipid-enriched compartments within cells. These transgenic strains not only represent high-contrast reporters of cell morphology and plasma membrane dynamics, but also may be used as in vivo sensors of lipid localization. Furthermore, combining these reporters with the study of mouse mutants will be a step forward in understanding the inter- and intracellular behaviors underlying morphogenesis in both normal and mutant contexts.


Figures

FIG. 1
FIG. 1
Localization of GPI- and myristoyl-tagged fluorescent proteins in live mouse ES cells. Live imaging of CAG::GFP-GPI and CAG::.myr-Venus hemizygous transgenic ES cells. The left column represents a single channel fluorescence image of either GFP-GPI or myr-Venus expression. The middle column represents nuclear fluorescence visualized using Draq5. The right column represents merged images of the GFP/Venus and Draq5 fluorescent channels. a: Single xy section taken from a z-stack of CAG::GFP-GPI/+ ES cells. b: Single xy section taken from a z-stack of CAG::myr-Venus/+ ES cells. c: 3D rendered image of a z-stack of 30 xy sections taken at 0.3 μm intervals of CAG::GFP-GPI ES cells. d: Image in c, tilted towards the viewer to show lateral information. e: 3D rendered image of a z-stack of 30, 0.3 μm optical sections of CAG::myr-Venus/+ ES cells. f: Image in e, tilted towards the viewer to show lateral information. All images were taken using a Plan-Neofluar 40x/1.3 objective. The electronic zoom factors (ZF) were: a = 5.1, b = 3.6, c and d = 5.0, e and f = 5.2. See text for description of arrows. The RGB-colored vector on the bottom left of the 3D rendered images depicts the orientation of x-axis in green, y-axis in red, and z-axis in blue. Note that the 3D reconstructions (c–f) do not include the full height of cells, otherwise the plasma membrane would obscure the visualization of information from within each cell. In all panels GFP fluorescence is displayed in green, Venus fluorescence in yellow, and Draq5 fluorescence in blue.
FIG. 2
FIG. 2
GPI-linked and myristoylated fluorescent protein localization in live preimplantation mouse embryos. Living embryos hemizygous for the CAG::myr-Venus or CAG::GFP-GPI transgenes were imaged by confocal laser scanning microscopy. A single xy section taken from a z-stack of a morula stage embryo, brightfield image (a: CAG::GFP-GPI/+; j: CAG::myr-Venus/+), overlay of single confocal section or yellow fluorescence and brightfield (b: CAG::GFP-GP/+; k: CAG::myr-Venus/+), yellow fluorescence channel only (left panel in c: CAG::GFP-GPI/; l: CAG::myr-Venus/+). Single fluorescence (xy) images taken at intervals through the z-stack (c: CAG::GFP-GPI/+; i: CAG::myr-Venus/+). Rendered z-stack (3D reconstruction) of computationally bisected embryo rotated 180° around the y-axis depicted in five incremental steps (h: CAG::GFP-GPI/+; q: CAG::myr-Venus/+). A single xy section taken from a z-stack of a blastocyst stage CAG::myr-Venus/+ embryo, brightfield image (e: CAG::GFP-GPI/+; n: CAG::myr-Venus/+), overlay of single confocal section or yellow fluorescence and brightfield (f: CAG::GFP-GPI/+; o: CAG::myr-Venus/+), yellow fluorescence channel only (left panel in g: CAG::GFP-GPI/+; p: CAG::myr-Venus/+). Single fluorescence (xy) images taken at intervals through the z-stack (g: CAG::GFP-GPI/+; p: CAG::myr-Venus/+). Rendered z-stack (3D reconstruction) of computationally bisected embryo rotated 180° around the y-axis depicted in five incremental steps (h: CAG::GFP-GPI/+; q: CAG::myr-Venus/+). Rendered z-stack (3D reconstruction) of a thin (10 μm) slice taken from the z-stack rotated 180° around the y-axis depicted in five incremental steps (i: CAG::GFP-GPI/+; r: CAG::myr-Venus/+). In all images Venus fluorescence is depicted in yellow and GFP fluorescence in green. All images were taken using a Plan-Neofluar 40x/1.3 objective. The RGB-colored vector on the bottom left of the 3D reconstruction rotations (d,h,i,m,q,r) depicts the x-axis in green, y-axis in red, and z-axis in blue. Red arrowheads highlight the position of the blastocoelic cavity; orange arrowhead highlights the remnants of the second polar body, blue arrowhead highlights a cell in mitosis; yellow arrowhead highlights the Golgi apparatus of a mural trophectoderm cell. In all panels GFP fluorescence is displayed in green and Venus fluorescence in yellow.
FIG. 3
FIG. 3
Widespread expression and subcellular localization of GPI-linked and myristoylated fluorescent protein expression in postimplantation mouse embryos. a–h: E9.5 embryos expressing either GFP-GPI or myr-Venus. a: Sagittal section of CAG::GFP-GPI/+ embryo (5× objective, electronic zoom factor (ZF) 0.7×). b: Sagittal section of CAG::myr-Venus/+ embryo. c: Transverse section through the forelimb region of CAG::GFP-GPI/+ embryo (20× objective, ZF 0.7×). d: Transverse section through forelimb region of CAG::myr-Venus/+ embryo. e: Higher magnification of ventral neural tube as marked in c (40× objective, ZF 1.5×). f: Higher magnification of ventral neural tube as marked in d. g: Higher magnification of developing gut as marked in c (40× objective, ZF 1.5×). h: Higher magnification of developing gut as marked in d. i–p: E13.5 embryos transgenic for and expressing either GFP-GPI or myr-Venus. i: Transverse section through the thoracic region of CAG::GFP-GPI/+ embryo (5× objective, ZF 0.7×). j: Transverse section through the thoracic region of CAG::myr-Venus/+ embryo. k: Higher magnification of ventral neural tube as marked in i (40× objective, ZF 0.7×). l: Higher magnification of ventral neural tube as marked in j. m: Higher magnification of lung as marked in l (40× objective, ZF 0.7×). n: Higher magnification of lung as marked in j. o: High magnification of a sagittal section through the heart of CAG::GFP-GPI/+ embryo (40× objective, ZF 4×). A field of developing myocardium is shown. p: High magnification of a sagittal section through the heart of CAG::myr-Venus/+ embryo. ht (heart), NT (neural tube), not (notochord), FP (floorplate), MA (mantle layer), ML (marginal layer), br (bronchiole), myo (myocardium). In all panels GFP fluorescence is displayed in green, Venus fluorescence in yellow, and Hoechst fluorescence in blue.
FIG. 4
FIG. 4
Widespread expression and subcellular localization of GPI-linked and myristoylated fluorescent protein expression in adult mouse tissues. Tissues from P4 animals hemizygous for either transgenic were used for all images. Venus fluorescence is depicted in yellow, GFP fluorescence in green, and Hoechst in blue. a: Composite of longitudinal section through kidney of CAG::GPI-GFP/+ animal (5× objective, ZF 0.7×). b: Composite of longitudinal section through kidney of CAG::myr-Venus/+ animal. c: Higher magnification of region marked in a (40× objective, ZF 1.6×). d: Higher magnification of region marked in b. e: Cross section through a CAG::GPI-GFP/+ heart (5× objective, ZF 0.7×). f: Cross section through a CAG::myr-Venus/+ heart (5× objective, ZF 0.7×). g: High magnification of single optical section from e (40× objective, ZF 4×). h: High magnification of single optical section from f (40× objective, ZF 4×). i: High magnification of single optical section through CAG::GPI-GFP/+ liver (40× objective, ZF 4×). j: High magnification of single optical section through CAG::myr-Venus/+ liver (40× objective, ZF 4×). k: 3D-rendered image of 34, 0.5 μm optical sections of CAG::GPI-GFP/+ liver tissue (40× objective, ZF 4×). The RGB-colored vector on the bottom left of the 3D rendered images depicts the x-axis in green, y-axis in red, and z-axis in blue. l: High magnification of single optical section through CAG::myr-Venus/+ liver (40× objective, ZF 4×). m: Cross section through a CAG::GPI-GFP/+ small intestine (40× objective, ZF 0.7×). n: Cross section through a CAG::myr-Venus/+ small intestine villi (40× objective, ZF 1.6×). o: Single optical section through the telencephalon of CAG::GPI-GFP/+ animal (5× objective, ZF 0.7×). Low magnification inset represents a composite from 12 single images. p: Single optical section through the telencephalon of CAG::myr-Venus/+. Low magnification inset represents a composite of 12 single images. kid (kidney), si (small intestine), vi (villus), liv (liver).
FIG. 5
FIG. 5
Differential localization of GFP-GPI and myr-Venus fusion proteins in E9.5 CAG::GFP-GPI/+; CAG::myr-Venus/+ double transgenic embryo. Linear unmixing of the independent GFP-variant fluorophores was used to identify unique and overlapping regions of reporter localization in different epithelial tissues. GPI-GFP fluorescence is depicted in green, myr-Venus fluorescence is false-colored red, and background residual pixels are in blue. a: Reporter expressions in E9.5 somites. Yellow arrowheads mark region of exclusive myr-Venus expression. b: Reporter expressions in E9.5 developing gut tube. White arrowheads mark exclusive GPI-GFP expression. c: Reporter expressions in E9.5 intermediate mesoderm. Blue arrowheads mark overlapping reporter expression.
FIG. 6
FIG. 6
Colocalization GFP-GPI or myr-Venus fusion proteins with Golgi markers in ES cells. Undifferentiated GFP-GPI ES cells (a) were stained and visualized for DAPI to label nuclei (blue), GFP was visualized directly (green), 58K Golgi was visualized with indirect immunofluorescence (red). The three fluorescent channels were merged (panel on the right). GFP-GPI ES cells mixed with nontransgenic ES cells and induced to differentiate (b) were stained and visualized for DAPI (blue), GFP (green), 58K Golgi (red). The three fluorescent channels were merged (panel on the right). Yellow spots that are perinuclearly located in four cells reveal regions of fluorescent protein and Golgi colocalization. Undifferentiated myr-Venus ES cells (c) were stained and visualized for DAPI (blue), Venus was visualized directly (green), 58K Golgi was visualized with indirect immunofluorescence (red). The three fluorescent channels were merged (panel on the right). Diffuse regions of yellow coloring that are perinuclearly located reveal regions of colocalization. Myr-venus ES cells mixed with nontransgenic ES cells and induced to differentiate (d) were stained and visualized for DAPI (blue), Venus (green), 58K Golgi (red). The three fluorescent channels were merged (panel on the right). Yellow spots that are perinuclearly located in two cells reveal regions of colocalization. Scale bars on the bottom right of all merge panels = 20 μm.
FIG. 7
FIG. 7
Differential vesicular distributions of GFP-GPI and myr-Venus fusion proteins in ES cells and in the somites of E9.5 transgenic embryos. Hemizygous GFP-GPI ES cells (a), myr-Venus ES cells (b), E9.5 GFP-GPI (c,e,g) or E9.5 myr-Venus (d,f,h) embryos were cultured in the presence of 0.5 mg/ml 10K Dextran to identify distributions to recycling endosomes of the secretory pathway. a: GPI-GFP ES cells treated with 10K Dextran show both distinct (green arrows, GPI-GFP-specific; red arrows, 10K Dextran specific) and common (yellow arrows, overlapping) distributions after treatment. b: myr-Venus ES cells treated with 10K Dextran show both distinct (green arrowheads, myr-Venus-specific; red arrowheads, 10K Dextran-specific) and common (yellow arrowheads, overlapping) distributions after treatment. c: Low magnification of lateral view of somite from E9.5 GFP-GPI embryo treated with 10K Dextran. 10K Dextran was observed in subcellular vesicles and trapped in the extracellular matrix after treatment. d: Low magnification lateral view of somite from E9.5 myr-Venus embryo treated with 10K Dextran. e,g. Higher magnification views of GPI-GFP somite show distinct (green arrowheads, GFP-GPI-specific; red arrowheads, 10K Dextran-specific) and common (yellow arrowheads, overlapping) distributions of the reporters. f,h: Higher magnification views of myr-Venus somite show distinct (green arrowheads, myr-Venus-specific; red arrowheads, 10K Dextran-specific) and common (yellow arrowheads, overlapping) distributions of the reporters. GFP-GPI and myr-Venus are both false-colored green, 10K Dextran is false-colored red.

References

    1. Anderson RG, Jacobson K. A role for lipid shells in targeting proteins to caveolae, rafts, and other lipid domains. Science. 2002;296:1821–1825. - PubMed
    1. Anderson R, Fassler R, Georges-Labouesse E, Hynes RO, Bader BL, Kreidberg JA, Schaible K, Heasman J, Wylie C. Mouse primordial germ cells lacking beta1 integrins enter the germline but fail to migrate normally to the gonads. Development. 1999;126:1655–1664. - PubMed
    1. Bissell MJ, Labarge MA. Context, tissue plasticity, and cancer: are tumor stem cells also regulated by the microenvironment? Cancer Cell. 2005;7:17–23. - PMC - PubMed
    1. Brown DA, London E. Structure and origin of ordered lipid domains in biological membranes. J Membr Biol. 1998;164:103–114. - PubMed
    1. Chalfie M, Tu Y, Euskirchen G, Ward WW, Prasher DC. Green fluorescent protein as a marker for gene expression. Science. 1994;263:802–805. - PubMed

Publication types

MeSH terms