

Rhodopsin photointermediates in two-dimensional crystals at physiological temperatures
- PMID: 16605265
- PMCID: PMC2556952
- DOI: 10.1021/bi0524619
Rhodopsin photointermediates in two-dimensional crystals at physiological temperatures
Abstract
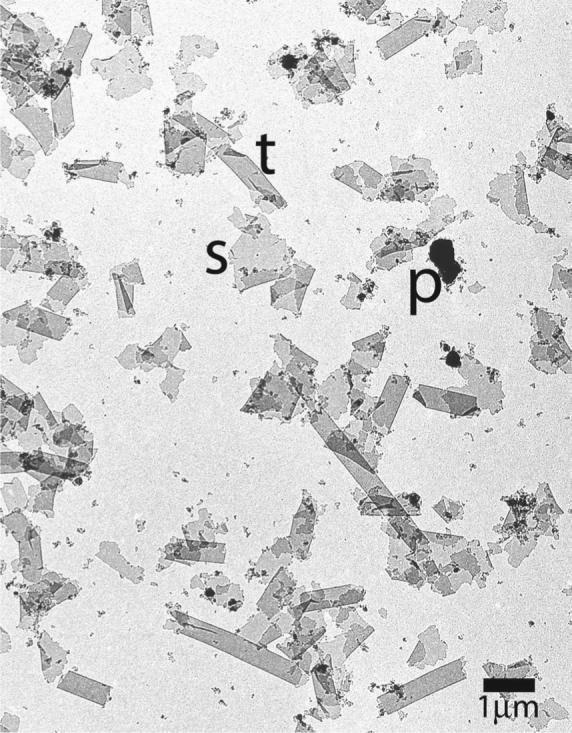
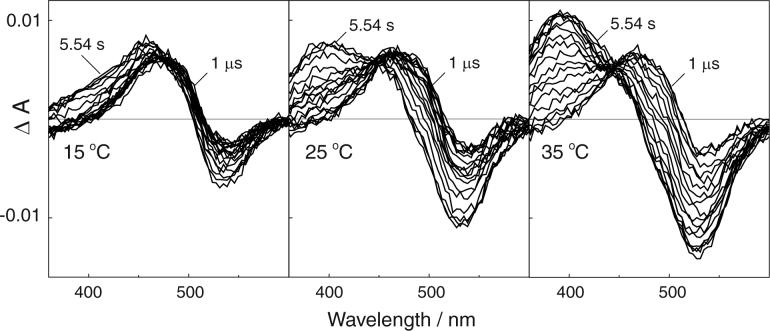
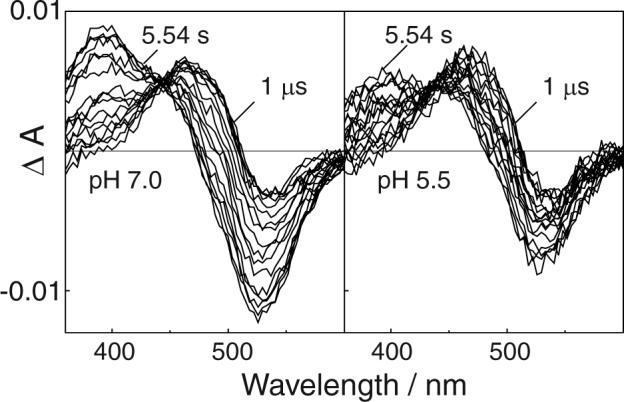
Bovine rhodopsin photointermediates formed in two-dimensional (2D) rhodopsin crystal suspensions were studied by measuring the time-dependent absorbance changes produced after excitation with 7 ns laser pulses at 15, 25, and 35 degrees C. The crystalline environment favored the Meta I(480) photointermediate, with its formation from Lumi beginning faster than it does in rhodopsin membrane suspensions at 35 degrees C and its decay to a 380 nm absorbing species being less complete than it is in the native membrane at all temperatures. Measurements performed at pH 5.5 in 2D crystals showed that the 380 nm absorbing product of Meta I(480) decay did not display the anomalous pH dependence characteristic of classical Meta II in the native disk membrane. Crystal suspensions bleached at 35 degrees C and quenched to 19 degrees C showed that a rapid equilibrium existed on the approximately 1 s time scale, which suggests that the unprotonated predecessor of Meta II in the native membrane environment (sometimes called MII(a)) forms in 2D rhodopsin crystals but that the non-Schiff base proton uptake completing classical Meta II formation is blocked there. Thus, the 380 nm absorbance arises from an on-pathway intermediate in GPCR activation and does not result from early Schiff base hydrolysis. Kinetic modeling of the time-resolved absorbance data of the 2D crystals was generally consistent with such a mechanism, but details of kinetic spectral changes and the fact that the residuals of exponential fits were not as good as are obtained for rhodopsin in the native membrane suggested the photoexcited samples were heterogeneous. Variable fractional bleach due to the random orientation of linearly dichroic crystals relative to the linearly polarized laser was explored as a cause of heterogeneity but was found unlikely to fully account for it. The fact that the 380 nm product of photoexcitation of rhodopsin 2D crystals is on the physiological pathway of receptor activation suggests that determination of its structure would be of interest.
Figures


Similar articles
-
Rhodopsin in nanodiscs has native membrane-like photointermediates.Biochemistry. 2011 Jun 7;50(22):5086-91. doi: 10.1021/bi200391a. Epub 2011 May 13. Biochemistry. 2011. PMID: 21539361 Free PMC article.
-
Temperature dependence of the lumirhodopsin I-lumirhodopsin II equilibrium.Biochemistry. 2010 Jul 20;49(28):5852-8. doi: 10.1021/bi100566r. Biochemistry. 2010. PMID: 20545328 Free PMC article.
-
The effects of octanol on the late photointermediates of rhodopsin.Photochem Photobiol. 1998 Nov;68(5):762-70. Photochem Photobiol. 1998. PMID: 9825706
-
Effects of pH on rhodopsin photointermediates from lumirhodopsin to metarhodopsin II.Biochemistry. 1998 May 12;37(19):6998-7005. doi: 10.1021/bi9728194. Biochemistry. 1998. PMID: 9578587
-
Time-resolved photointermediate changes in rhodopsin glutamic acid 181 mutants.Biochemistry. 2004 Oct 5;43(39):12614-21. doi: 10.1021/bi049581l. Biochemistry. 2004. PMID: 15449951
Cited by
-
Curvature and hydrophobic forces drive oligomerization and modulate activity of rhodopsin in membranes.Biophys J. 2006 Dec 15;91(12):4464-77. doi: 10.1529/biophysj.106.082776. Epub 2006 Sep 29. Biophys J. 2006. PMID: 17012328 Free PMC article.
-
Cannabinoid CB1 receptor recognition of endocannabinoids via the lipid bilayer: molecular dynamics simulations of CB1 transmembrane helix 6 and anandamide in a phospholipid bilayer.J Comput Aided Mol Des. 2006 Jul-Aug;20(7-8):495-509. doi: 10.1007/s10822-006-9068-9. Epub 2006 Nov 14. J Comput Aided Mol Des. 2006. PMID: 17106765
-
Role of bulk water in hydrolysis of the rhodopsin chromophore.J Biol Chem. 2011 May 27;286(21):18930-7. doi: 10.1074/jbc.M111.234583. Epub 2011 Apr 1. J Biol Chem. 2011. PMID: 21460218 Free PMC article.
-
Activation of G protein-coupled receptors: beyond two-state models and tertiary conformational changes.Annu Rev Pharmacol Toxicol. 2008;48:107-41. doi: 10.1146/annurev.pharmtox.48.113006.094630. Annu Rev Pharmacol Toxicol. 2008. PMID: 17848137 Free PMC article. Review.
References
-
- Kliger DS, Lewis JW. Spectral and kinetic characterization of visual pigment photointermediates. Isr. J. Chem. 1995;35:289–307.
-
- Vilardaga J-P, Bünemann M, Krasel C, Castro M, Lohse MJ. Measurement of the millisecond activation switch of G protein-coupled receptors in living cells. Nature Biotechnol. 2003;21:807–812. - PubMed
-
- Kobilka B. Agonist Binding: A Multistep Process. Mol. Pharmacol. 2004;65:1060–1062. - PubMed
-
- Hoffmann C, Gaietta G, Bunemann M, Adams SR, Oberdorff-Maass S, Behr B, Vilardaga JP, Tsien RY, Eisman MH, Lohse MJ. A FlAsH-based FRET approach to determine G protein - coupled receptor activation in living cells. Nature Meth. 2005;2:171–176. - PubMed
-
- Okada T, Sugihara M, Bondar AN, Elstner M, Entel P, Buss V. The retinal conformation and its environment in rhodopsin in light of a new 2.2 angstrom crystal structure. J. Mol. Biol. 2004;342:571–583. - PubMed
Publication types
MeSH terms
Substances
Grants and funding
LinkOut - more resources
Full Text Sources
Miscellaneous
