

Correlation analysis of two-dimensional gel electrophoretic protein patterns and biological variables
- PMID: 16606449
- PMCID: PMC1559651
- DOI: 10.1186/1471-2105-7-198
Correlation analysis of two-dimensional gel electrophoretic protein patterns and biological variables
Abstract
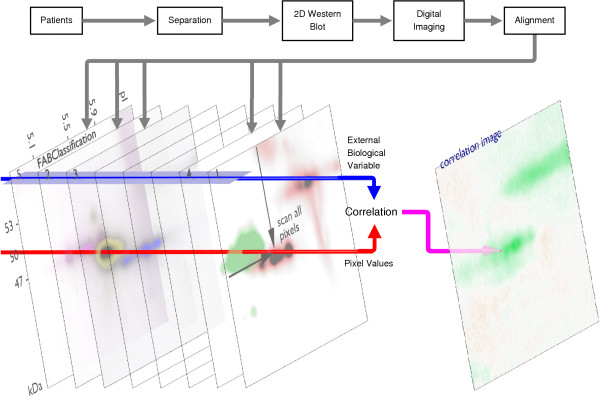
Background: Two-dimensional gel electrophoresis (2DE) is a powerful technique to examine post-translational modifications of complexly modulated proteins. Currently, spot detection is a necessary step to assess relations between spots and biological variables. This often proves time consuming and difficult when working with non-perfect gels. We developed an analysis technique to measure correlation between 2DE images and biological variables on a pixel by pixel basis. After image alignment and normalization, the biological parameters and pixel values are replaced by their specific rank. These rank adjusted images and parameters are then put into a standard linear Pearson correlation and further tested for significance and variance.
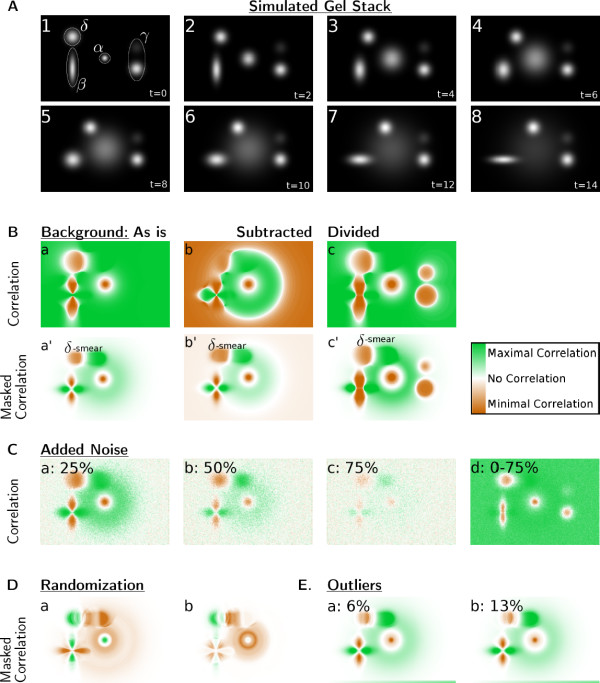
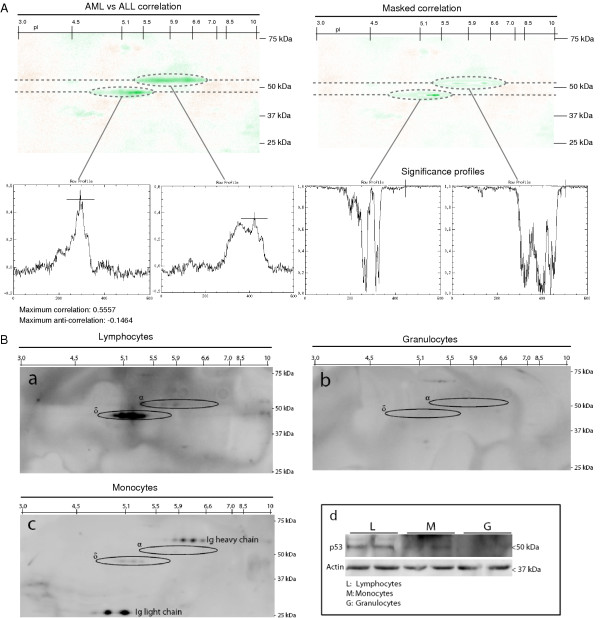
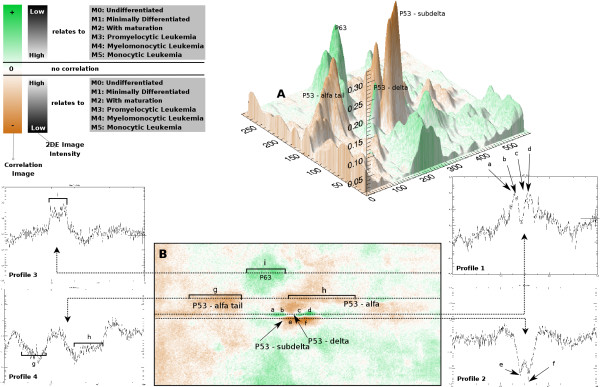
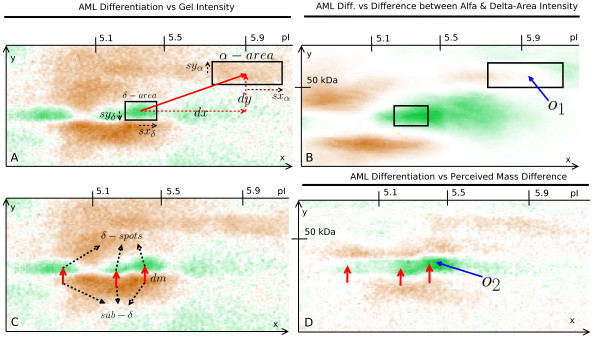
Results: We validated this technique on a set of simulated 2DE images, which revealed also correct working under the presence of normalization factors. This was followed by an analysis of p53 2DE immunoblots from cancer cells, known to have unique signaling networks. Since p53 is altered through these signaling networks, we expected to find correlations between the cancer type (acute lymphoblastic leukemia and acute myeloid leukemia) and the p53 profiles. A second correlation analysis revealed a more complex relation between the differentiation stage in acute myeloid leukemia and p53 protein isoforms.
Conclusion: The presented analysis method measures relations between 2DE images and external variables without requiring spot detection, thereby enabling the exploration of biosignatures of complex signaling networks in biological systems.
Figures
Similar articles
-
Gel2DE - a software tool for correlation analysis of 2D gel electrophoresis data.BMC Bioinformatics. 2013 Jul 6;14:215. doi: 10.1186/1471-2105-14-215. BMC Bioinformatics. 2013. PMID: 23829206 Free PMC article.
-
Improved two-dimensional electrophoretic mapping of Japanese human hair proteins; application to curved and straight Japanese human hairs; and protein identification by MALDI MS and MS/MS quadrupole time-of-flight mass spectrometry.Int J Cosmet Sci. 2020 Aug;42(4):346-358. doi: 10.1111/ics.12621. Epub 2020 Jul 5. Int J Cosmet Sci. 2020. PMID: 32251525
-
Leukocyte p53 protein biosignature through standard-aligned two-dimensional immunoblotting.J Proteomics. 2012 Dec 5;76 Spec No.:69-78. doi: 10.1016/j.jprot.2012.07.021. Epub 2012 Jul 26. J Proteomics. 2012. PMID: 22842154 Clinical Trial.
-
The state of the art in the analysis of two-dimensional gel electrophoresis images.Appl Microbiol Biotechnol. 2007 Oct;76(6):1223-43. doi: 10.1007/s00253-007-1128-0. Epub 2007 Aug 23. Appl Microbiol Biotechnol. 2007. PMID: 17713763 Free PMC article. Review.
-
Two-dimensional electrophoresis in proteome expression analysis.J Chromatogr B Analyt Technol Biomed Life Sci. 2007 Apr 15;849(1-2):190-202. doi: 10.1016/j.jchromb.2006.11.049. Epub 2006 Dec 22. J Chromatogr B Analyt Technol Biomed Life Sci. 2007. PMID: 17188947 Review.
Cited by
-
Two-Dimensional Gel Electrophoresis Image Analysis.Methods Mol Biol. 2021;2361:3-13. doi: 10.1007/978-1-0716-1641-3_1. Methods Mol Biol. 2021. PMID: 34236652
-
A Comparison of p53 Isoform Profiles and Apoptosis Induced by Camptothecin or a Herbal Khat Extract (Catha Edulis (Vahl) Forssk. ex Endl.) in Leukemic Cell Lines: Exploring Cellular Responses in Therapy Development.Cancers (Basel). 2020 Dec 1;12(12):3596. doi: 10.3390/cancers12123596. Cancers (Basel). 2020. PMID: 33271840 Free PMC article.
-
Phosphotyrosine protein dynamics in cell membrane rafts of sphingosine-1-phosphate-stimulated human endothelium: role in barrier enhancement.Cell Signal. 2009 Dec;21(12):1945-60. doi: 10.1016/j.cellsig.2009.09.002. Epub 2009 Sep 13. Cell Signal. 2009. PMID: 19755153 Free PMC article.
-
Proteomics Profiling of Pancreatic Cancer and Pancreatitis for Biomarkers Discovery.J Cell Sci Ther. 2018;9(4):287. doi: 10.4172/2157-7013.1000287. Epub 2018 Nov 28. J Cell Sci Ther. 2018. PMID: 31032145 Free PMC article.
-
Gel2DE - a software tool for correlation analysis of 2D gel electrophoresis data.BMC Bioinformatics. 2013 Jul 6;14:215. doi: 10.1186/1471-2105-14-215. BMC Bioinformatics. 2013. PMID: 23829206 Free PMC article.
References
-
- Celis J, Moreira J, Cabezon T, Gromob P, Friis R, Rank F, Gromova I. Identification of extracellular and intracellular signaling components of the mammary adipose tissue and its interstitial fluid in high risk breast cancer patients: toward dissecting the molecular circuitry of epithelial-adipocyte stromal cell interactions. Mol Cell Proteomics. 2005;4:492–522. doi: 10.1074/mcp.M500030-MCP200. - DOI - PubMed
-
- Boyd R, Adams P, Patel S, Loader J, Berry J, Redpath N, Poyser H, Fletcher G, Burgess N, Stamps A, Hudson L, Smith P, Griffiths M, Willis T, Karran E, DG O, Catovsky D, Terrett J, Dyer M. Proteomic Analysis of the cell-surface membrane in chronic lymphocytic leukemia: identification of two novel proteins, BCNP1 and MIG2B. Leukemia. 2003;17:1605–1612. doi: 10.1038/sj.leu.2402993. - DOI - PubMed
-
- Gjertsen BT, Oyan A, Marzolf B, Hovland R, Gausdal G, Doskeland SO, Dimitrov K, Golden A, Kalland K, Hood L, Bruserud Ø. Analysis of acute myelogenous leukemia: preparation of samples for genomic and proteomic analysis. J Hematother Stem Cell Res. 2002;11:469–81. doi: 10.1089/15258160260090933. - DOI - PubMed
Publication types
MeSH terms
Substances
LinkOut - more resources
Full Text Sources
Other Literature Sources
Medical
Molecular Biology Databases
Research Materials
Miscellaneous
