. 2006 Jun 23;281(25):17517-17527.
doi: 10.1074/jbc.M600807200. Epub 2006 Apr 10.

Lysosomal localization of TRPML3 depends on TRPML2 and the mucolipidosis-associated protein TRPML1

Affiliations

Lysosomal localization of TRPML3 depends on TRPML2 and the mucolipidosis-associated protein TRPML1

Kartik Venkatachalam et al. J Biol Chem. .

Abstract

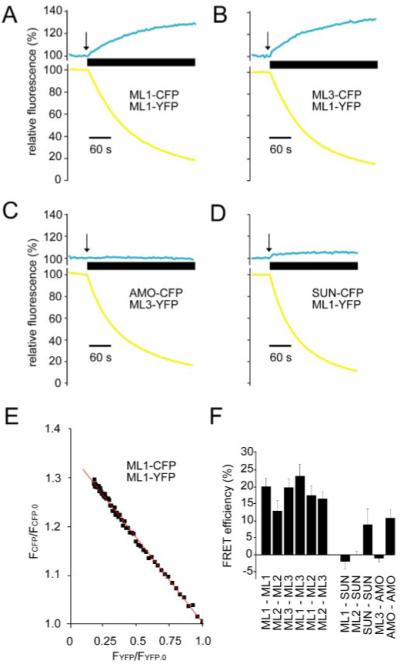
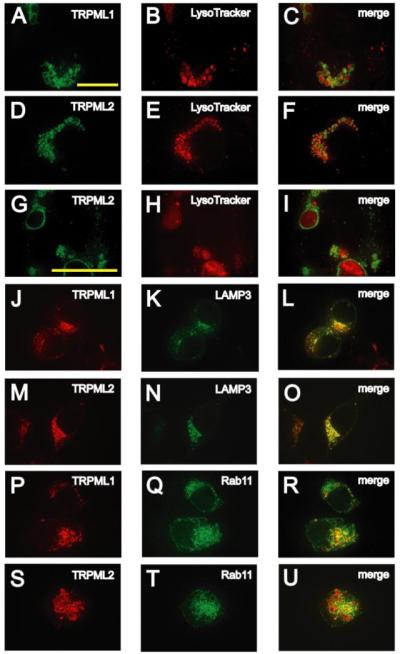
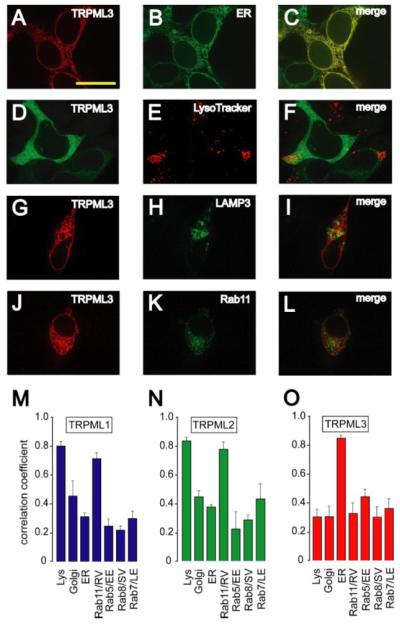
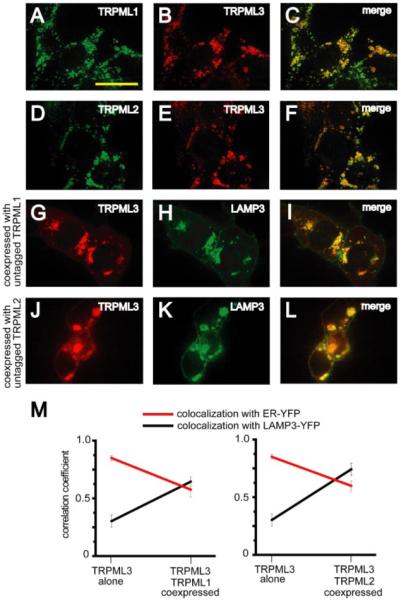
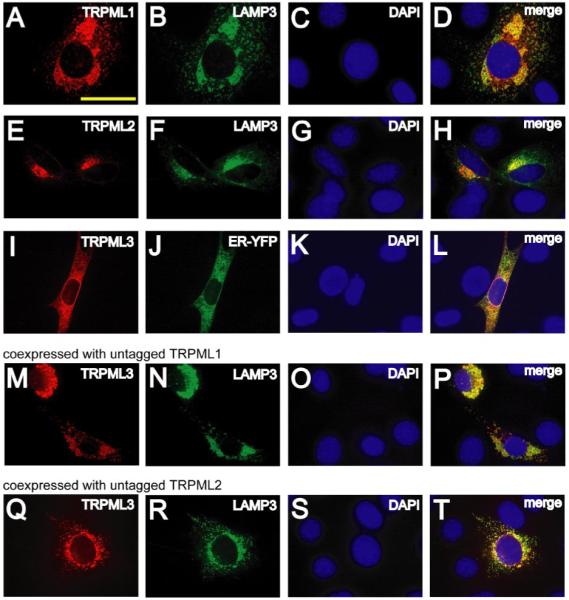
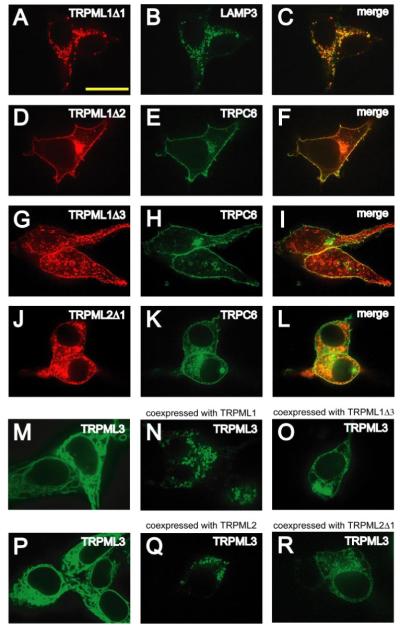
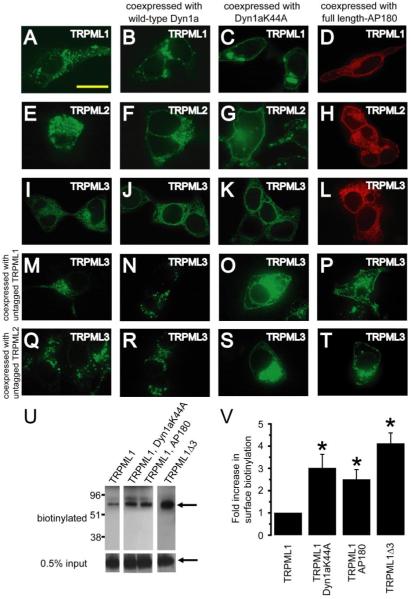
Mucolipidosis type IV is an autosomal recessive lysosomal storage disorder characterized by severe neurodegeneration, achlorhydria, and visual impairments such as corneal opacity and strabismus. The disease arises due to mutations in a group 2 transient receptor potential (TRP)-related cation channel, TRPML1. Mammals encode two additional TRPML proteins named TRPML2 and TRPML3. Information regarding the propensity of these proteins to multimerize, their subcellular distribution and mechanisms that regulate their trafficking are limited. Here we demonstrate that TRPMLs interact to form homo- and heteromultimers. Moreover, the presence of either TRPML1 or TRPML2 specifically influences the spatial distribution of TRPML3. TRPML1 and TRPML2 homomultimers are lysosomal proteins, whereas TRPML3 homomultimers are in the endoplasmic reticulum. However, TRPML3 localizes to lysosomes when coexpressed with either TRPML1 or TRPML2 and is comparably mislocalized when lysosomal targeting of TRPML1 and TRPML2 is disrupted. Conversely, TRPML3 does not cause retention of TRPML1 or TRPML2 in the endoplasmic reticulum. These data demonstrate that there is a hierarchy controlling the subcellular distributions of the TRPMLs such that TRPML1 and TRPML2 dictate the localization of TRPML3 and not vice versa.


Figures

FIGURE 1
FIGURE 1. TRPMLs interact with each other to form multimers
A, representative traces showing FRET between TRPML1-YFP and TRPML1-CFP. Changes in the relative fluorescence (percent) of CFP and YFP emissions are plotted against time (seconds). The thick horizontal bar denotes the duration of application of acceptor-photobleach, the initiation of the photobleach is indicated by the arrow. A 60-s scale bar is shown. B, FRET between TRPML1-YFP and TRPML3-CFP. C, representative traces demonstrating absence of FRET between TRPML3-YFP and AMO-CFP. D, absence of FRET between TRPML1-YFP and Sun-CFP. E, representative linear regression analysis of fractional donor (TRPML1-CFP) recovery (FCFP/FCFP.0) versus fractional acceptor (TRPML1-YFP) photobleach (FYFP/FYFP.0). F, bar graph showing the FRET efficiencies (percentage) between the various pairs of proteins as indicated along the x axis. Averages are results of three to five separate experiments in each case, and error bars indicate S.E.
FIGURE 2
FIGURE 2. Subcellular localizations of TRPML1 and TRPML2
A and B, confocal images of fixed HEK293 cells that were transfected with TRPML1-YFP, loaded with LysoTracker-Red (100 nm) and viewed at the indicated excitation wavelengths. A, 488 nm, TRPML1-YFP, green; B, 568 nm, Lyso-Tracker-Red, red. C, merge of A and B. D–F, same as A–C but in HEK293 cells transfected with TRPML2-YFP. G–I, same as D–F but at 1.6× higher magnification. J and K, confocal images of HEK293 cells co-transfected with TRPML1-HA and LAMP3-YFP in which immunofluorescence was performed with anti-HA primary antibodies and Alexa568-conjugated secondary antibodies and viewed at the indicated excitation wavelengths: 568 nm, TRPML1-HA, red (J) and 488 nm, LAMP3-YFP, green (K). L, merge of J and K. M–O, same as J–L but in HEK293 cells cotransfected with TRPML2-HA and LAMP3-YFP. P–R, same as J–L but in HEK293 cells cotransfected with TRPML1-HA and GFP-Rab11. S–U, same as J–L but in HEK293 cells co-transfected with TRPML2-HA and GFP-Rab11. The scale bar shown in A is applicable to all the panels except G–I, which utilize the scale bar shown in G. All scale bars represent 20 μm.
FIGURE 3
FIGURE 3. Subcellular localization of TRPML3
A and B, confocal images of HEK293 cells cotransfected with TRPML3-HA and ER-YFP. The immunofluorescence was performed with anti-HA primary antibodies and Alexa568-conjugated secondary antibodies and viewed at the indicated excitation wavelengths: 568 nm, TRPML3-HA, red (A); 488 nm, ER-YFP, green (B). C, merge of A and B. D–F, confocal images of fixed HEK293 cells that were transfected with TRPML3-YFP, loaded with Lyso-Tracker-Red (100 nm) and viewed at the indicated excitation wavelengths: 488 nm, TRPML3-YFP, green (D); 568 nm, LysoTracker-Red, red (E). F, merge of D and E. G–I, same as A–C but in HEK293 cells co-transfected with TRPML3-HA and LAMP3-YFP. J–L, same as A–C but in HEK293 cells co-transfected with TRPML3-HA and GFP-Rab11. Scale bar represents 20 μm. M–O, bar graphs quantifying colocalization of TRPMLs with various markers for subcellular organelles indicated along the x axis: TRPML1 (M), TRPML2 (N), and TRPML3 (O). Averages are based on three to five separate experiments in each case, and error bars indicate S.E. Unpaired student t tests indicated that the enrichment of TRPML1 and TRPML2 in lysosomes and TRPML3 in the ER relative to other organelles was statistically significant (p < 0.001).
FIGURE 4
FIGURE 4. Translocation of TRPML3 to lysosomes as a result of coexpression with either TRPML1 or TRPML2
A and B, confocal images of HEK293 cells cotransfected with TRPML1-HA and TRPML3-MYC. Immunofluorescence was performed with anti-HA primary/Alexa488-conjugated secondary and anti-MYC primary/Alexa568-conjugated secondary antibodies at the indicated excitation wavelengths: 488 nm, TRPML1-HA, green (A); 568 nm, TRPML3-MYC, red (B). C, merge of A and B. D–F, same as A–C but in HEK293 cells co-transfected with TRPML2-HA and TRPML3-MYC. G–I, confocal images of HEK293 cells cotransfected with TRPML3-HA, untagged TRPML1, and LAMP3-YFP. Immunofluorescence was performed with anti-HA primary antibodies and Alexa568-conjugated secondary antibodies at the indicated excitation wavelengths: 568 nm, TRPML3-HA, red (G); 488 nm, LAMP3-YFP, green (H). I, merge of G and H. J–L, same as G–I but in HEK293 cells cotransfected with TRPML3-HA, untagged TRPML2, and LAMP3-YFP. Scale bar represents 20 μm. M, quantification of decrease in ER localization (red) and an increase in lysosomal localization (black) of TRPML3 when coexpressed with either TRPML1 (left) or TRPML2 (right). Averages are based on three to five separate experiments in each case, and error bars indicate S.E.
FIGURE 5
FIGURE 5. Subcellular localizations of TRPMLs in NIH3T3 cells
A–C, confocal images of DAPI-loaded NIH3T3 cells co-transfected with TRPML1-HA and LAMP3-YFP in which immunofluorescence was performed with anti-HA primary antibodies and Alexa568-conjugated secondary antibodies and viewed at the indicated excitation wavelengths: 568 nm, TRPML1-HA, red (A); 488 nm, LAMP3-YFP, green (B); 360 nm, DAPI, blue (C). D, merge of A–C. E–H, same as A–D but in DAPI-loaded NIH3T3 cells co-transfected with TRPML2-HA and LAMP3-YFP. I–L, same as A–D but in DAPI-loaded NIH3T3 cells co-transfected with TRPML3-HA and ER-YFP. M–O, confocal images of DAPI loaded NIH3T3 cells previously co-transfected with TRPML3-HA, untagged TRPML1, and LAMP3-YFP. Immunofluorescence was performed with anti-HA primary antibodies and Alexa568-conjugated secondary antibodies at the indicated excitation wavelengths: 568 nm, TRPML3-HA, red (M); 488 nm, LAMP3-YFP, green (N); 360 nm, DAPI, blue (O). P, merge of M–O. Q–T, same as M–P but in DAPI-loaded NIH3T3 cells co-transfected with TRPML3-HA, untagged TRPML2, and LAMP3-YFP. Scale bar represents 20 μm.
FIGURE 6
FIGURE 6. Signals responsible for lysosomal localization of TRPML1 and TRPML2
A and B, confocal images of HEK293 cells previously co-transfected with TRPML1Δ1-HA and LAMP3-YFP in which immunofluorescence was performed with anti-HA primary antibodies and Alexa568-conjugated secondary antibodies and the cells were viewed at the indicated excitation wavelengths: 568 nm, TRPML1Δ1-HA, red (A); 488 nm, LAMP3-YFP, green (B). C, merge of A and B. D–L, same as A–C but in HEK293 cells co-transfected with either TRPML1Δ2-HA and TRPC6-YFP, TRPML1Δ3-HA and TRPC6-YFP, or TRPML2Δ1-HA and TRPC6-YFP, respectively. M–O, confocal images of HEK293 cells transfected with vectors encoding the following and viewed at an excitation wavelength of 488 nm: TRPML3-YFP alone (M), TRPML3-YFP and TRPML1 (N), TRPML3-YFP and TRPML1Δ2 (O). P–R, same as M–O except in HEK293 cells transfected with: TRPML3-YFP alone (P), TRPML3-YFP and TRPML2 (Q), or TRPML3-YFP and TRPML2Δ1 (R). The scale bar represents 20 μm.
FIGURE 7
FIGURE 7. Coexpression with mislocalized TRPML1 or TRPML2 causes mislocalization of TRPML3
A, confocal image of fixed HEK293 cells that were previously transfected with TRPML1-YFP at the excitation wavelength of 488 nm. B and C, same as A but in HEK293 cells co-transfected with: TRPML1-YFP and Dyn1aWT (B) or Dyn1aK44A (C). D, confocal image of HEK293 cells co-transfected with TRPML1-HA and full-length AP180 and in which immunofluorescence was performed with anti-HA primary antibodies and Alexa568-conjugated secondary antibodies and viewed at an excitation wavelength of 568 nm. E–H, same as A–D but with TRPML2-YFP instead of TRPML1-YFP. I–L, same as A–D but with TRPML3-YFP instead of TRPMl1-YFP. M–P, confocal images of HEK293 cells co-transfected with vectors encoding the following and viewed at an excitation wavelength of 488 nm: TRPML3-YFP and TRPML1 (M); TRPML3-YFP, TRPML1 and wild-type Dyn1a (N); TRPML3-YFP, TRPML1, and Dyn1aK44A (O); and TRPML3-YFP, TRPML1, and full-length AP180 (P). Q–T, same as M–P but with TRPML2 instead of TRPML1. The scale bar represents 20 μm. U, increased biotinylation of TRPML1 due to inhibition of clathrin-mediated endocytosis and deletion of lysosomal targeting motif. The Western blot shows extracts prepared from HEK293 cells expressing TRPML1-HA alone (left lane), TRPML1-HA with Dyn1aK44A or AP180 (middle lanes), and TRPML1Δ3-HA alone (right lane). The extracts were prepared following surface biotinylation and the biotinylated proteins were purified. The blot was probed with anti-HA primary antibodies and horseradish peroxidase-conjugated secondary antibodies. Upper panels show surface-biotinylated fractions. The arrow indicates the 65-kDa TRPML1 band. The lower panels show the 0.5% input, with the arrow indicating the TRPML1 band. V, bar graphs showing the fold-increase in the TRPML1-HA surface biotinylation upon inhibition of clathrin-mediated endocytosis or as a result of mutating the lysosomal targeting motif. Averages are based on three separate experiments in each case and the error bars indicate S.E. Unpaired Student’s t tests indicate that the fold increase in surface biotinylation of TRPML1-HA was statistically significant (p < 0.05) upon coexpression with Dyn1aK44A or full-length AP180 or upon removal of the lysosomal targeting motif.

References

    1. Bach G. Mol. Genet. Metab. 2001;73:197–203. - PubMed
    1. Bach G. Pfluegers. Arch. 2005;451:313–317. - PubMed
    1. Altarescu G, Sun M, Moore DF, Smith JA, Wiggs EA, Solomon BI, Patronas NJ, Frei KP, Gupta S, Kaneski CR, Quarrell OW, Slaugenhaupt SA, Goldin E, Schiffmann R. Neurology. 2002;59:306–313. - PubMed
    1. Chen CS, Bach G, Pagano RE. Proc. Natl. Acad. Sci. U. S. A. 1998;95:6373–6378. - PMC - PubMed
    1. Soyombo AA, Tjon-Kon-Sang S, Rbaibi Y, Bashllari E, Bisceglia J, Muallem S, Kiselyov K. J. Biol. Chem. 2006;281:7294–7301. - PubMed

Publication types