

doi: 10.1084/jem.20052507.
Epub 2006 Apr 10.
Evidence for discrete stages of human natural killer cell differentiation in vivo
Affiliations
- PMID: 16606675
- PMCID: PMC2118285
- DOI: 10.1084/jem.20052507
Item in Clipboard
Evidence for discrete stages of human natural killer cell differentiation in vivo
J Exp Med.
.
Abstract
Human natural killer (NK) cells originate from CD34(+) hematopoietic progenitor cells, but the discrete stages of NK cell differentiation in vivo have not been elucidated. We identify and functionally characterize, from human lymph nodes and tonsils, four NK cell developmental intermediates spanning the continuum of differentiation from a CD34(+) NK cell progenitor to a functionally mature NK cell. Analyses of each intermediate stage for CD34, CD117, and CD94 cell surface expression, lineage differentiation potentials, capacity for cytokine production and natural cytotoxicity, and ETS-1, GATA-3, and T-BET expression provide evidence for a new model of human NK cell differentiation in secondary lymphoid tissues.
Figures
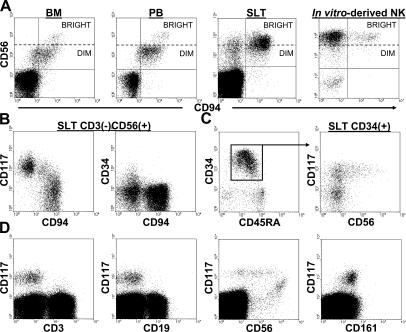
Surface marker expression patterns of human SLT populations. (A) CD3(−)CD56brightCD94(−) cells are absent in BM and PB, yet present in human SLT and in NK cell differentiation cultures. All four dot plots were gated on CD3(−) events. (B) Distinct patterns of CD34, CD117, and CD94 expression within the CD3(−)CD56(+) fraction of human SLT. The dot plots were gated on total CD3(−)CD56(+) events. (C) A continuum of CD56 expression is observed within the CD117(+) fraction of SLT CD34(+) HPCs. The left dot plot shows CD34 versus CD45RA expression within a CD34-enriched preparation from human SLT. The right dot plot was gated on CD34(+) events as indicated by the box and arrow in the left dot plot. (D) Analysis of CD3, CD19, CD56, and CD161 expression on total CD34(−)CD117(+) cells within the mononuclear fraction of human SLT. The dot plots were gated on CD34(−) SLT preparations. No qualitative differences were observed in comparing LN and tonsil specimens. The data are representative of at least five separate analyses.

Progressive CD56 expression by in vivo stages of human NK cell differentiation. The data were obtained by first separating CD3(−)CD19(−)CD34(+) and CD3(−)CD19(−)CD34(−) fractions from SLT mononuclear cell suspensions via magnetic selection and then assessing for CD34, CD117, CD94, and CD56 expression by flow cytometry. It was confirmed that residual T cells or B cells did not contribute to the data.
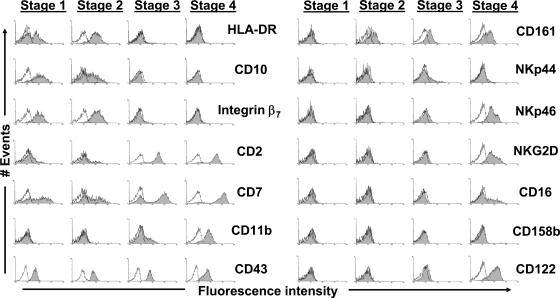
Surface marker expression profiles of stages 1–4. Data were obtained by performing flow cytomtric analyses of CD3(−)CD19(−)CD34(+) and CD3(−)CD19(−)CD34(−) cell preparations as in Fig. 2. Shaded regions represent staining for the indicated surface antigens, whereas solid lines (open regions) represent staining with appropriate isotype-matched control mAbs. The data shown are representative of at least three separate experiments for each antigen, and we did not observe any differences in comparing LN and tonsil specimens.
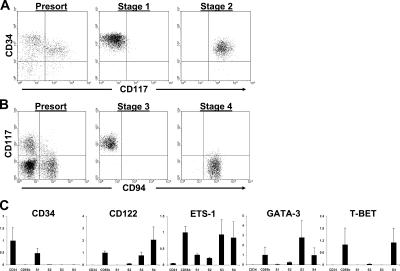
Gene expression profiles of stages 1–4. (A and B) Representative sorts to purify stages 1–4 from human SLT. Stages 1 and 2 (A) and stages 3 and 4 (B) were sorted from CD3(−)CD19(−)CD34(+) and CD3(−)CD19(−)CD34(−) fresh SLT cell preparations, respectively, obtained via magnetic selection as described in Materials and methods. Additional flow cytometric analyses confirmed that sorted stage 3 and 4 cells were CD34(−) (not depicted). (C) Gene expression analysis of stages 1–4. Gene expression for each sample was normalized to 18S expression. Depending on the preferential expression of each gene of interest, the mean of normalized values from either total PB CD34(+) HPCs or total PB CD56bright NK cells was set to a value of 1, and all other normalized values were adjusted to scale. The y axis of each graph is in arbitrary units and measures the adjusted value for each population. The data are expressed as the mean of adjusted values ± SD of 3–5 separate samples tested per cell population (n = 3–5). CD34, PB CD34(+) HPCs; CD56b, PB CD56bright NK cells; S1, stage 1; S2, stage 2; S3, stage 3; S4, stage 4.

Functional analyses of stages 3 and 4. (A) Perforin expression of freshly isolated stage 3 and 4 cells as detected by intracellular flow cytometry. Shaded regions represent staining with the anti-perforin mAb whereas solid lines (open regions) represent staining with the isotype-matched control mAb. Histograms were gated on unsorted CD3(−)CD19(−) preparations from human SLT using mAbs directed against CD34, CD117, and CD94 to identify discrete stages for analysis. Stages 1 and 2 lack detectable intracellular perforin staining (not depicted). (B) Percentages of specific lysis against K562 (black bars) and Jurkat (gray bars) targets by freshly isolated stage 3 and 4 cells. Data shown are the mean results ± SD of four separate experiments performed in triplicate at a 20:1 E/T ratio. (C) Stage 4 cells mediate FasL-dependent, but not TRAIL-dependent, killing of Jurkat target cells. Data shown are the mean results ± SD of triplicate wells from one experiment with freshly isolated stage 4 cells targeted against the Jurkat cell line as in B but in the presence of 1 mM EGTA and 2 mM MgCl2 (20:1 E/T ratio). (D) Production of IFN-γ (left) and GM-CSF (right) by stage 3 and 4 cells after 12-h stimulation with either the combination of IL-12, IL-15, and IL-18 (black bars) or the combination of PMA, ionomycin, and IL-2 (gray bars). Data shown are the combined results ± SD of four separate experiments (n = 4 for each).
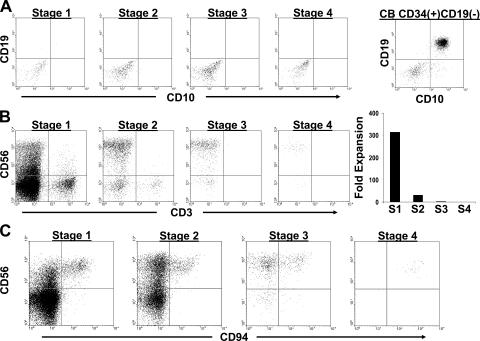
B and T cell differentiation potential of stages 1–4. (A) Representative analysis from one of two experiments culturing SLT-derived stages 1–4 or CB-derived CD34(+)CD19(−) cells on MS-5 stroma in FL, KL, and G-CSF for 6 wk. Dot plots were gated on live cells using a lymphocyte gate by FSC versus SSC. (B) Representative analysis from one of three experiments in which stages 1–4 were co-cultured for 4–5 wk on the OP9-DL1 cell line in FL and IL-7. The OP9-DL1 line expresses GFP. The four dot plots shown were gated on GFP(−) events within the live fraction by FSC versus SSC analysis. The graph on the right shows the fold increase in total GFP(−) cell number starting with 103 cells from each stage (S1–S4). n = 1 (representative graph from one of three experiments). (C) Generation of CD3(−)CD56brightCD94(+) stage 4 cells on OP9-DL1 stroma. Stage 1–4 cells were cultured as in B. The dot plots shown were gated on GFP(−)CD3(−) live cell events and are representative of three separate experiments.

DC differentiation potential of stages 1–4. (A and B) Representative flow cytometric analysis from one of three experiments culturing stages 1–4 in FL, KL, IL-3, IL-4, GM-CSF, and TNF-α. (A) By FSC versus SSC analysis, only stage 1 and 2 cultures contained the population (black circles) notably absent in stage 3 and 4 cultures. (B) Shaded regions in the histograms represent staining for the indicated surface antigens whereas solid lines (open regions) represent staining with isotype-matched control mAbs. The histograms were gated on the populations circled in A from stage 1 and 2 cultures. We did not observe any qualitative differences between stage 1– and stage 2–derived DCs. (C) Wright/Giemsa staining of stage 1– and stage 2–derived DCs. Note the typical DC morphology, including multiple dendrite processes and the large nucleus displaced to one side of the cell. Viable cells in stage 3 cultures did not display the DC morphology (not depicted).

Stage 1 and 2 NK cell developmental progression. (A) Sorted stage 1 and 2 cells were cultured in IL-15 for 2 wk and then total viable cell counts were determined. Cultures were initiated with 103 starting cells. Shown are the mean results from seven separate experiments ± SD. n = 7. (B) Representative phenotypic analysis of stage 2 cells cultured in IL-15 for 2 wk. The few viable cells remaining in stage 1 cultures after 2 wk in IL-15 displayed a similar phenotype shown for cultured stage 2 cells. (C) Limiting dilution analysis of stages 1 and 2 cultured in either IL-15 alone (◯) or IL-15 with the one time addition of FL, IL-3, and IL-7 at the initiation of culture (▪). The graphs show initiating stage 1 and 2 cell numbers versus the percentages of NK-positive wells for one of two separate experiments yielding similar results. (D) De novo generation of CD34(+)CD117(+) cells from purified stage 1 cells. Purified stage 1 and 2 cells were cultured for 4 d in FL, IL-3, IL-7, and IL-15 and then analyzed by flow cytometry for the expression CD34 and CD117. Unsorted, unstained CD34-enriched cell preparations (obtained via magnetic selection) were cultured in parallel to set voltages and compensation parameters on the flow cytometer. Results are representative of three separate experiments.

Stage 3 to 4 differentiation ex vivo. (A) Proliferation of stage 3 and 4 cells cultured in IL-15. Shown are the mean results ± SD from seven separate experiments starting with 103 cells. n = 7. (B) Representative phenotypic analysis of one of three experiments with stage 3 and 4 cells cultured either in IL-15 (left dot plot for each population) or in IL-15 plus activated autologous SLT T cells (right dot plot for each population). All four dot plots were gated on total CD3(−) events, and none of the cultured cells expressed CD34 (not depicted). Cultures initiated with activated SLT T cells alone did not contain CD3(−)CD94(+) cells (reference 9).
References
-
- Colucci, F., M.A. Caligiuri, and J.P. Di Santo. 2003. What does it take to make a natural killer? Nat. Rev. Immunol. 3:413–425. - PubMed
-
- Yokoyama, W.M., S. Kim, and A.R. French. 2004. The dynamic life of natural killer cells. Annu. Rev. Immunol. 22:405–429. - PubMed
-
- Mrozek, E., P. Anderson, and M.A. Caligiuri. 1996. Role of interleukin-15 in the development of human CD56+ natural killer cells from CD34+ hematopoietic progenitor cells. Blood. 87:2632–2640. - PubMed
Publication types
MeSH terms
Substances
Grants and funding
LinkOut - more resources
Full Text Sources
Other Literature Sources
Miscellaneous
