. 2006 May;127(5):511-24.
doi: 10.1085/jgp.200509392. Epub 2006 Apr 10.

Coupling modes and stoichiometry of Cl-/HCO3- exchange by slc26a3 and slc26a6

Affiliations

Coupling modes and stoichiometry of Cl-/HCO3- exchange by slc26a3 and slc26a6

Nikolay Shcheynikov et al. J Gen Physiol. 2006 May.

Abstract

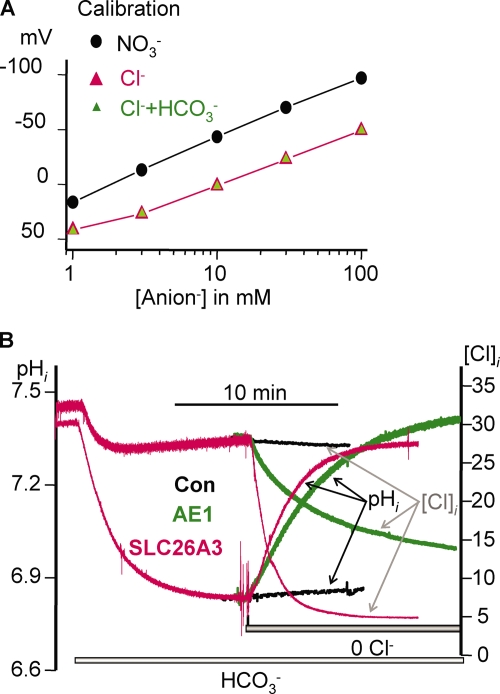
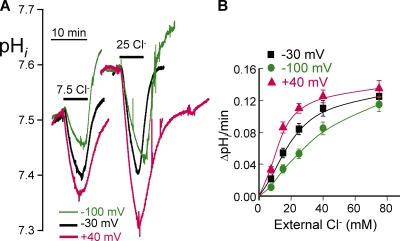
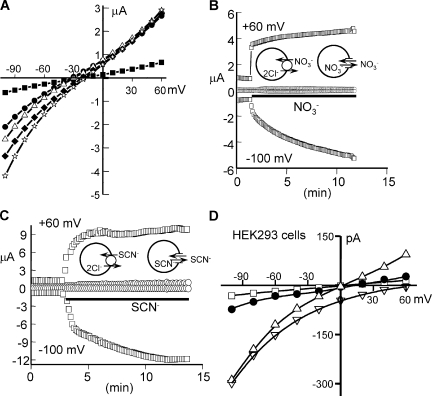
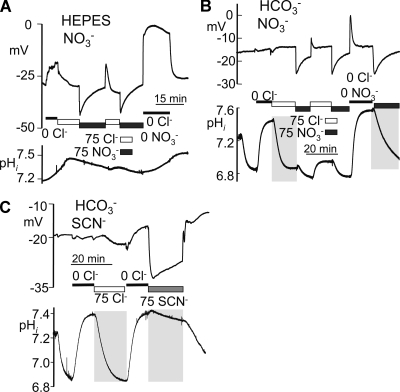
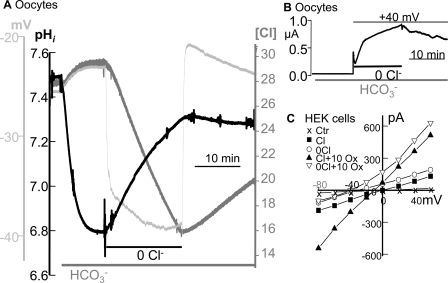
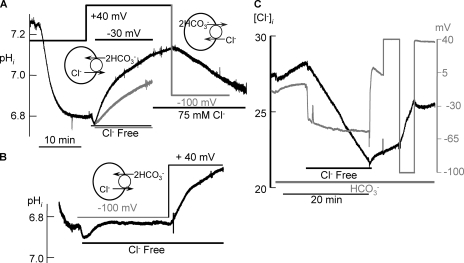
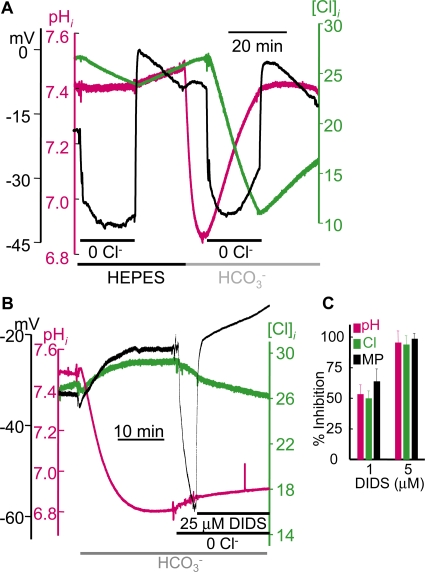
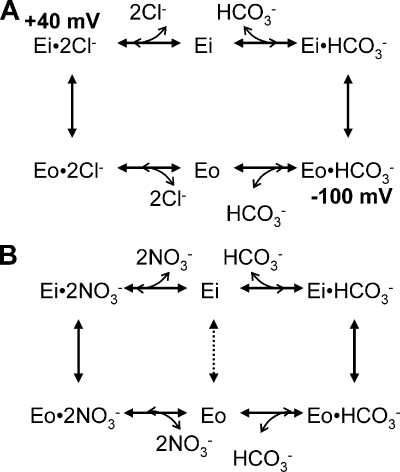
The SLC26 transporters are a family of mostly luminal Cl- and HCO3- transporters. The transport mechanism and the Cl-/HCO3- stoichiometry are not known for any member of the family. To address these questions, we simultaneously measured the HCO3- and Cl- fluxes and the current or membrane potential of slc26a3 and slc26a6 expressed in Xenopus laevis oocytes and the current of the transporters expressed in human embryonic kidney 293 cells. slc26a3 mediates a coupled 2Cl-/1HCO3- exchanger. The membrane potential modulated the apparent affinity for extracellular Cl- of Cl-/HCO3- exchange by slc26a3. Interestingly, the replacement of Cl- with NO3- or SCN- uncoupled the transport, with large NO3- and SCN- currents and low HCO3- transport. An apparent uncoupled current was also developed during the incubation of slc26a3-expressing oocytes in HCO3--buffered Cl--free media. These findings were used to develop a turnover cycle for Cl- and HCO3- transport by slc26a3. Cl- and HCO3- flux measurements revealed that slc26a6 mediates a 1Cl-/2HCO3- exchange. Accordingly, holding the membrane potential at 40 and -100 mV accelerated and inhibited, respectively, Cl--mediated HCO3- influx, and holding the membrane potential at -100 mV increased HCO3--mediated Cl- influx. These findings indicate that slc26a6 functions as a coupled 1Cl-/2HCO3- exchanger. The significance of isoform-specific Cl- and HCO3- transport stoichiometry by slc26a3 and slc26a6 is discussed in the context of diseases of epithelial Cl- absorption and HCO3- secretion.


Figures

Figure 1.
Figure 1.
Stoichiometry of Cl/HCO3 exchange by slc26a3. (A) An example of a calibration of the Cl electrode and that the resin is not sensitive to 90 mM HCO3 (green triangles) and is more selective for NO3 (black circles) than Cl (red triangles). In B, control Xenopus oocytes (black traces) and an oocyte expressing AE1 (green traces) or slc26a3 (red traces) were bathed in HCO3 -buffered media, and, after the stabilization of pHi, they were incubated in Cl-free media. The initial rates of pHi and Cli changes were used to calculate the fluxes and the Cl/HCO3 stoichiometry that are listed in Table 1. For simplicity, the changes in pHi and Cli caused by exposure to CO2/HCO3 are shown only for the oocyte expressing slc26a3. In this and all other experiments, the traces shown are from representative experiments, and the number of experiments and means are given in the text.
Figure 2.
Figure 2.
Coupling of Cl and HCO3 transport by slc26a3. In A, an oocyte expressing slc26a3 was exposed to Cl-free medium while incubated in HEPES-buffered and HCO3 -buffered media. Red trace, pHi; green trace, Cli ; black trace, membrane potential. In B, current generated by Cli /OHo and Cli /HCO3o exchange was measured in a control oocyte (black trace) and an oocyte expressing slc26a3 (blue trace) while holding the membrane potential at −90 mV. In C, an oocyte expressing slc26a3 and incubated in HCO3 -buffered media was exposed to Cl-free medium at 10 min and was then exposed to different Clo between 7.5 and 75 mM, as indicated by the bars, while measuring pHi (blue trace) or Cli (green trace). The rates of pHi (squares) and Cli (circles) changes from three experiments are summarized in D. Error bars represent SEM.
Figure 3.
Figure 3.
Effect of the membrane potential on HCO3 transport by slc26a3. The protocol shown in Fig. 2 C was used to measure changes in pHi except that the changes in pHi at each Clo concentration were measured while holding the membrane potential alternately at −30, −100, and 40 mV. The membrane potential was clamped after the stabilization of Cli and for 30 s before and during the duration of the subsequent measurement of Cl/HCO3 exchange. No more that three Cl concentrations were tested in each oocyte to minimize error caused by the deterioration of the signal. (A) Example traces from the same oocyte exposed to 7.5 and 25 mM Clo while holding the membrane potential at −30 (black traces), −100 (green traces), or 40 mV (red traces). Results from at least three measurements at each Cl concentration and at the indicated membrane potentials, similar to those in Fig. 3 A, are plotted in B and show the Clo -dependence of HCO3 transport at −30 (squares), −100 (circles), and 40 mV (triangles). Error bars represent SEM.
Figure 4.
Figure 4.
NO3 and SCN current by slc26a3. Xenopus oocytes expressing slc26a3 and bathed in HEPES-buffered media (A–C) were incubated in media in which Clo was replaced with NO3 (A and B) or SCN (C) while measuring the I-V relationship (A) or the current (B and C) at a holding membrane potential of −30 mV and sampling every 10 s by stepping to −100 and 60 mV for 50 ms. In A, the oocyte was incubated in Cl-containing media (squares) or NO3 -containing media for 1 (circles), 3 (triangles), 5 (diamonds), or 10 min (stars). B and C show the current measured in control (circles) and slc26a3 (squares)-expressing oocytes. The models in B and C show the possible modes of transport at the beginning and end of the incubation period with NO3 and SCN. (D) The I-V relationship in an HEK293 cell transfected with GFP (squares) or with GFP and slc26a3 and dialyzed with NO3i and incubated in Na+-free medium in which the major anion was NO3 (squares and triangles), gluconate (inverted triangles), or Cl (circles). The traces in A–D are from single experiments, and the means and number of experiments are given in the text.
Figure 5.
Figure 5.
Uncoupled NO3 and SCN fluxes by slc26a3. Xenopus oocytes expressing slc26a3 were bathed in HEPES-buffered (A) or HCO3 -buffered media (B and C). As indicated by the solid bars, they were exposed to Cl-free media, and, after the stabilization of pHi, the rates of Cl/HCO3 and NO3 /HCO3 exchange (B) or Cl/HCO3 and SCN/HCO3 exchange (C) were compared, as marked by the gray areas. In each panel, the changes in membrane potential are shown in the top trace, and the changes in pHi are shown in the bottom trace. Note the slow NO3 /HCO3 exchange and the very slow SCN/HCO3 exchange. The number of experiments and means are given in the text.
Figure 6.
Figure 6.
Stoichiometry of Cl/HCO3 exchange by slc26a6. (A) Xenopus oocyte expressing slc26a6 and bathed in HCO3 -buffered media was incubated in Cl-free and Cl-containing medium as indicated. The rates of HCO3 (heavy black trace) and Cl (heavy gray trace) transport initiated by the removal of Clo were used to calculate the Cl/HCO3 transport stoichiometry of slc26a6, and the results of multiple experiments are given in Table 1. The light gray trace shows the change in membrane potential. (B) The current was measured in an oocyte expressing slc26a6 and bathed in HCO3 -buffered media. Where indicated, the membrane potential was clamped at 40 mV, and the effect of Cl removal and readdition on the current was measured. (C) The HEK293 cell expressing slc26a6 was dialyzed with Na+-free pipette solution containing 150 mM Cli and bathed in Na+-free solutions containing 150 mM Cl (squares), gluconate (circles), Cl and 10 mM oxalate (triangles), or gluconate and oxalate (inverted triangles), and the I-V relationship was determined between −80 and 60 mV. The number of experiments and means are given in the text.
Figure 7.
Figure 7.
Effect of the membrane potential on HCO3 and Cl transport by slc26a6. A Xenopus oocyte expressing slc26a6 was bathed in HCO3 -buffered media. (A) After the stabilization of pHi, the membrane potential was clamped at −30 (gray trace) or 40 mV (black trace) before exposing the oocyte to Cl-free medium. Where indicated, Clo was restored, and, after an additional 5 min, the membrane potential was switched from 40 to −100 mV (gray period). (B) After stabilization of the pHi of the oocyte incubated in HCO3 -buffered media, the membrane potential was clamped at −100 mV, and the oocyte was exposed to Cl-free medium (gray period). Where indicated by the black period, the membrane potential was switched to 40 mV. The models depict the mode of exchange measured at each period. (C) After the stabilization of Cli (black trace), the oocyte was incubated in Cl-free medium without holding the membrane potential was then incubated in the presence of Clo while holding the membrane potential at 40 or −100 mV as indicated. Note the initiation of Cl influx into the oocytes by holding the membrane potential at −100 mV. Each experiment is representative of at least three others with similar results.
Figure 8.
Figure 8.
Coupling of Cl and HCO3 transport by slc26a6. (A) An oocyte expressing slc26a6 was incubated in Cl-free medium while bathed in HEPES-buffered and HCO3 -buffered media. Red trace, pHi; green trace, Cli ; black trace, membrane potential. This experiment is representative of three others with similar results. (B) An oocyte expressing slc26a6 and bathed in HCO3 -buffered media was incubated in Cl-free medium, and, shortly after the removal of Clo , 25 μM DIDS was added to the perfusate, which halted the Cl (green trace) and HCO3 (red trace) fluxes and reversed the hyperpolarization (black trace). (C) Summary of the changes in pHi (red bars), Cli (green bars), and membrane potential (MP; black bars) recorded in four experiments in which oocytes expressing slc26a6 bathed in HCO3 -buffered media were incubated with either 1 or 5 μM DIDS before the incubation in Cl-free media that contained the respective concentrations of DIDS. The effect of preincubation with 25 μM DIDS, which completely inhibited the fluxes and the associated change in membrane potential, was taken as 100% to calculate the percent inhibition by 1 and 5 μM DIDS. Error bars represent SEM.
Figure 9.
Figure 9.
Models of coupled and uncoupled anion transport by slc26a3. (A) A model of the turnover cycle of coupled 2Cl/1HCO3 exchange by slc26a3. (B) A model for the turnover cycles of uncoupled NO3 and SCN transport by slc26a3.

Similar articles

Cited by

References

    1. Accardi, A., and C. Miller. 2004. Secondary active transport mediated by a prokaryotic homologue of ClC Cl- channels. Nature. 427:803–807. - PubMed
    1. Bissig, M., B. Hagenbuch, B. Stieger, T. Koller, and P.J. Meier. 1994. Functional expression cloning of the canalicular sulfate transport system of rat hepatocytes. J. Biol. Chem. 269:3017–3021. - PubMed
    1. Boron, W.F. 1986. Intracellular pH regulation in epithelial cells. Annu. Rev. Physiol. 48:377–388. - PubMed
    1. Chernova, M.N., L. Jiang, D.J. Friedman, R.B. Darman, H. Lohi, J. Kere, D.H. Vandorpe, and S.L. Alper. 2005. Functional comparison of mouse slc26a6 anion exchanger with human SLC26A6 polypeptide variants: differences in anion selectivity, regulation, and electrogenicity. J. Biol. Chem. 280:8564–8580. - PubMed
    1. Cook, D.I., E.W. Van Lennep, M.L. Roberts, and J.A. Young. 1994. Secretion by the major salivary glands. In Textbook of Physiology of the Gastrointestinal Tract. L.R. Johnson, editor. Raven Press, New York. 1061–1117.

Publication types

MeSH terms