. 2006 Apr 10;173(1):69-82.
doi: 10.1083/jcb.200506159.

Drosophila melanogaster Scramblases modulate synaptic transmission

Affiliations

Drosophila melanogaster Scramblases modulate synaptic transmission

Usha Acharya et al. J Cell Biol. .

Abstract

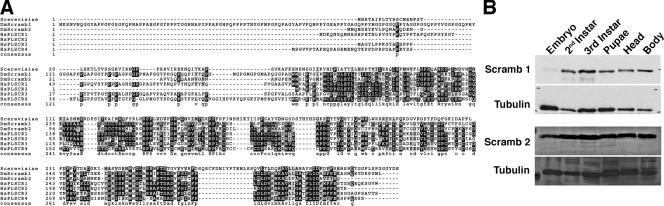
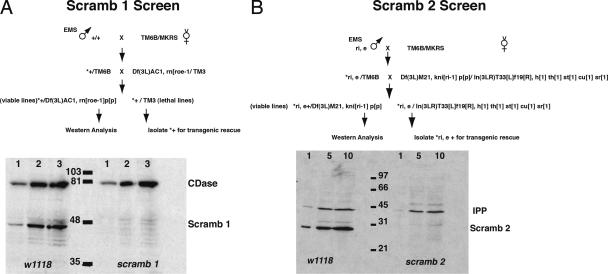
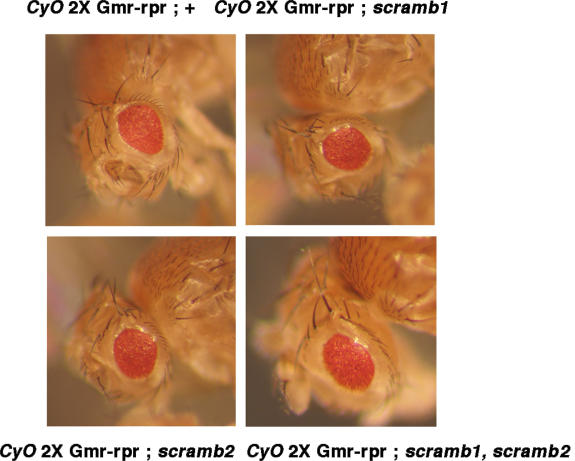
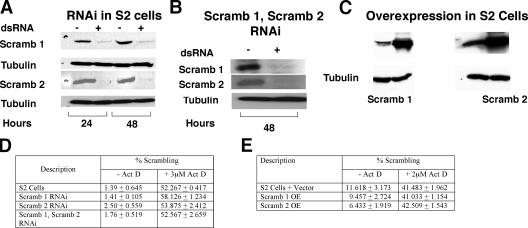
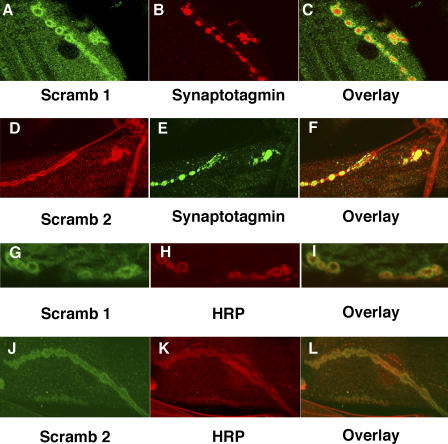
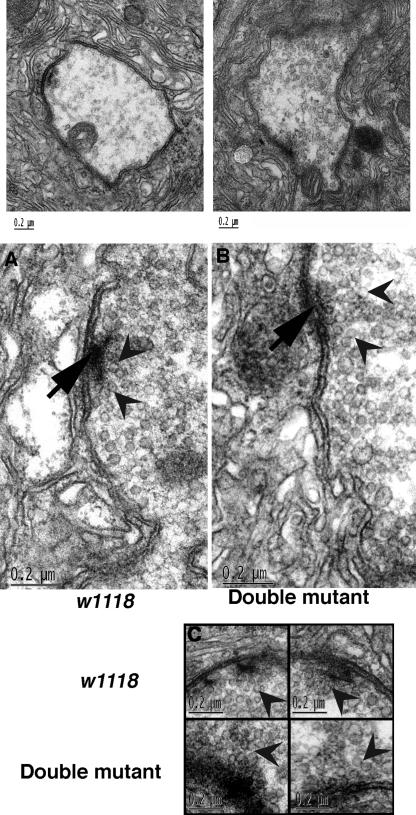
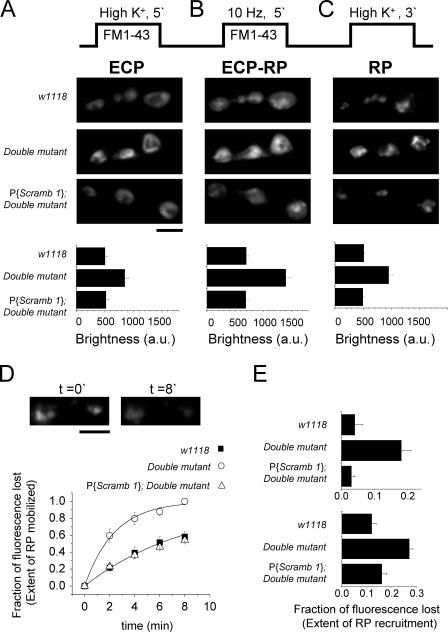
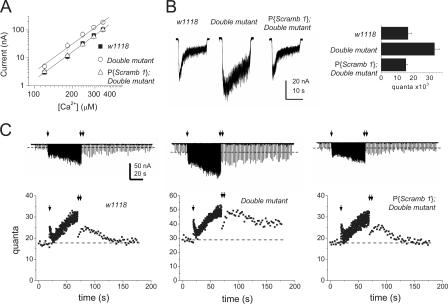
Scramblases are a family of single-pass plasma membrane proteins, identified by their purported ability to scramble phospholipids across the two layers of plasma membrane isolated from platelets and red blood cells. However, their true in vivo role has yet to be elucidated. We report the generation and isolation of null mutants of two Scramblases identified in Drosophila melanogaster. We demonstrate that flies lacking either or both of these Scramblases are not compromised in vivo in processes requiring scrambling of phospholipids. Instead, we show that D. melanogaster lacking both Scramblases have more vesicles and display enhanced recruitment from a reserve pool of vesicles and increased neurotransmitter secretion at the larval neuromuscular synapses. These defects are corrected by the introduction of a genomic copy of the Scramb 1 gene. The lack of phenotypes related to failure of scrambling and the neurophysiological analysis lead us to propose that Scramblases play a modulatory role in the process of neurotransmission.


Figures

Figure 1.
Figure 1.
Scramblases are evolutionarily conserved and ubiquitously expressed. (A) Comparison of the amino acid sequences of Saccharomyces cerevisiae Scramblase homologue, Yjr100cp, D. melanogaster Scramb 1 and 2 (DmScramb 1 and 2), and human Scramblases 1–4 (HsPLSCR1-4) proteins using multiple sequence alignment and box shade programs. (B) Extracts were prepared from D. melanogaster during various stages of development as indicated, and 5 μg of extracts were loaded on gel and probed for Scramb 1 and 2 protein as indicated. Blots were reprobed for tubulin as loading controls.
Figure 2.
Figure 2.
Generation and isolation of Scramblase mutants. (A) The genetic scheme to isolate the scramb1 mutant. (B) The scheme to obtain mutants in Scramb 2. The Western blot analysis of the null mutants is shown below the schemes. For scramb1, analysis of 1, 2, and 3 head extracts were loaded and probed. The blot was probed for D. melanogaster ceramidase (CDase) as loading control (Acharya et al., 2003, 2004). In the blot for scramb2-null mutant analysis, 1, 5, and 10 head worth of extracts from control w1118 and the mutant were loaded and probed for the protein. The blots were probed for Inositol polyphosphate 1-phosphatase (IPP) as loading control (Acharya et al., 1998).
Figure 3.
Figure 3.
Scramblase mutants can undergo apoptotic cell death and mount an effective immune response. Two copies of reaper were expressed under the control of GMR promoter. Expression of reaper results in apoptotic cell death of photoreceptors. Expression in scramb1, scramb2, or the double mutant did not affect reaper-induced apoptosis.
Figure 4.
Figure 4.
Scramblase proteins are not involved in cell surface exposure of PS. (A) S2 cells were transfected with Scramb 1 or 2 dsRNA, and cells were harvested 24 and 48 h after transfection and analyzed by Western analysis for Scramb 1 or 2 protein. Both Scramb 1 and 2 are down-regulated tremendously by RNAi-mediated knockdown. The extracts were probed for tubulin as loading controls. (B) Both Scramb 1 and 2 were knocked down in S2 cells simultaneously, and cells were assayed for protein 48 h after transfection. Both proteins are down-regulated in this experiment. (C) Stable cell lines overexpressing Scramb 1 or 2 proteins under the control of a metallothionein promoter were established. Both proteins are massively expressed upon induction in these cells. The extracts were probed for tubulin as controls. (D and E) The percentage of cells that stain positively for annexin V binding and negatively for propidium iodide were counted and plotted as percentage of scrambling. (D) Annexin V–positive cells in those that have undergone RNAi-mediated knockdown. (E) Scramblase overexpressing cells. RNAi-mediated knockdown cells were subject to 3 μM Actinomycin D for 3 h, and the percentage of scrambling cells was determined (D; +Act D column). As the baseline percentage of apoptotic cells was slightly higher in cells overexpressing Scramblase (E; −Act D column; probably due to the addition of 1 mM copper sulfate to induce protein), 2 μM Actinomycin D was used and the percentage of scrambling calculated (E; +Act D column).
Figure 5.
Figure 5.
Scramblase proteins localize to the larval NMJs. The Scramblase proteins were localized by anti–Scramb 1 monoclonal (A and G) and rabbit anti–Scramb 2 polyclonal antibodies. Rabbit anti-synaptotagmin (B) or monoclonal (E) and anti-HRP (H and K) were used in coimmunolocalization. The overlays are shown in C, F, I, and L.
Figure 6.
Figure 6.
Scramblase mutants have an increased number of SVs in the active zone. (top) Transmission electron micrograph of a synaptic bouton from control w1118 and the double mutant. (middle) Transmission EM comparison of the active zones from a control w1118 and the double mutant. The arrows indicate the T-bar in the active zone. Arrowheads show the vesicles clustered close to this area. (bottom) The top two figures show the active zones from w1118 type 1b synaptic boutons, and the bottom two figures are from the double mutants.
Figure 7.
Figure 7.
FM1-43 imaging. Studies of FM1-43 loading were made using the same FM1-43 stock, and the dye concentration was 5 μM. Data shown in graphs was derived from 25 boutons from 10 different larvae ± SEM. In all cases, fluorescence brightness was measured 3 min after extensive perfusion with a dye-free solution. (A) Studies of FM1-43 loading of ECP. Images are representative examples of dye-loading patterns in w1118, double mutant, and P{Scramb 1}; double mutant synaptic boutons. The graph below offers mean values of fluorescence brightness in w1118, double mutant, and P{Scramb 1}; double mutant synaptic boutons. (B) Studies of FM1-43 loading of SVs cycling through ECP and RP. Images are representative examples obtained in w1118, double mutant, and P{Scramb 1}; double mutant. Graph shows mean fluorescence brightness values ± SEM in w1118, double mutant, and P{Scramb 1}; double mutant. (C) Studies of dye loading of SVs cycling through RP. Images are representative examples of dye-loading patterns of SVs cycling through RP, and the graph shows mean fluorescence brightness values ± SEM. A t test revealed that in all cases differences in fluorescence brightness between double mutant, w1118, and P{Scramb 1}; double mutant are significant (P < 0.05). In all conditions, fluorescence brightness in control and P{Scramb 1}; double mutant was not statistically different. (D) Enhanced RP recruitment in double-mutant synapses and rescue in P{Scramb 1}; double mutant during high-frequency stimulation of the nerve. After dye loading of SVs cycling through RP was achieved using protocol explained in C, the time course of RP recruitment was evaluated by following the decline in fluorescence brightness during tetanic nerve stimulation at 10 Hz. The images above the graph show patterns of FM1-43 fluorescence at t = 0 and after 8 min of nerve stimulation at 10 Hz. Lines joining experimental points in graph are best fits to single exponential functions with time constants of 2.4 ± 0.2 min (double mutant) and 8.5 ± 0.2 min in control and P{Scramb 1}; double mutant. (E, top) Enhanced RP recruitment at rest, in the absence of high-frequency stimulation, in double mutant and rescue in P{Scramb 1}; double mutant. (bottom) Enhanced RP recruitment in double mutant during low-frequency stimulation (5 min) at 0.5 Hz in double mutant and rescue in P{Scramb 1}; double mutant. The extent of RP recruitment was evaluated 5 min after SVs cycling through the RP were loaded with FM1-43. Mean values of relative fluorescence brightness were derived from at least 10 different boutons from five different larvae. Bars, 5 μm.
Figure 8.
Figure 8.
Abnormal properties of transmitter release in the double mutant and rescue in P{Scramb 1}; double mutant larval neuromuscular synapses. (A) Ca2+ dependence of transmitter release. Straight lines joining experimental points were built, with mean slope values derived from five different studies. (B) Studies of osmotic release of neurotransmitter. Records are representative examples of postsynaptic currents evoked by application of hyperosmotic solution, illustrating enlarged responses in double mutant and rescue in P{Scramb 1}; double mutant. The graph shows mean values of quantal content of currents evoked, estimated by dividing the integral of charge transferred during hyperosmotic shock divided by the integral of charge transferred by release of single quanta. Graph show means of six different studies ± SEM. Quantal content in double mutant was significantly above control and P{Scramb 1}; double mutant (P < 0.05). Within experimental error, quantal content of postsynaptic currents evoked by hyperosmotic shock was the same in control and P{Scramb 1}; double mutant. (C) Tetanic facilitation and PTP induced by high-frequency stimulation of the nerve at 10 Hz. The recordings document enlarged nerve-evoked responses in double mutant and rescue of responses in P{Scramb 1}; double mutant and are representative of postsynaptic currents evoked during application of the protocol used to monitor tetanic facilitation and PTP. The graphs are mean quantal content of nerve-evoked currents during paradigm to monitor tetanic facilitation and PTP. Single arrows indicate the moment at which frequency of stimulation was switched from 0.5 to 10 Hz, leading to an increase in transmitter release (tetanic facilitation). Double arrows signal the moment at which stimulating frequency was switched back to 0.5 Hz. The discontinuous lines in the plots indicate quantal content of evoked currents before application of tetanic stimulation. Points in plot are means of at least seven different studies. Error bars were excluded for clarity.

References

    1. Acharya, J.K., P. Labarca, R. Delgado, K. Jalink, and C.S. Zuker. 1998. Synaptic defects and compensatory regulation of inositol metabolism in inositol polyphosphate 1-phosphatase mutants. Neuron. 20:1219–1229. - PubMed
    1. Acharya, U., S. Patel, E. Koundakjian, K. Nagashima, X. Han, and J.K. Acharya. 2003. Modulating sphingolipid biosynthetic pathway rescues photoreceptor degeneration. Science. 299:1740–1743. - PubMed
    1. Acharya, U., M.B. Mowen, K. Nagashima, and J.K. Acharya. 2004. Ceramidase expression facilitates membrane turnover and endocytosis of rhodopsin in photoreceptors. Proc. Natl. Acad. Sci. USA. 101:1922–1926. - PMC - PubMed
    1. Aho, S., and J. Uitto. 1998. Two-hybrid analysis reveals multiple direct interactions for thrombospondin 1. Matrix Biol. 17:401–412. - PubMed
    1. Babcock, M., G.T. Macleod, J. Leither, and L. Pallanck. 2004. Genetic analysis of soluble N-ethylmaleimide-sensitive factor attachment protein function in Drosophila reveals positive and negative secretory roles. J. Neurosci. 24:3964–3973. - PMC - PubMed

Publication types

MeSH terms