

Integrated analysis of regulatory and metabolic networks reveals novel regulatory mechanisms in Saccharomyces cerevisiae
- PMID: 16606697
- PMCID: PMC1457053
- DOI: 10.1101/gr.4083206
Integrated analysis of regulatory and metabolic networks reveals novel regulatory mechanisms in Saccharomyces cerevisiae
Abstract
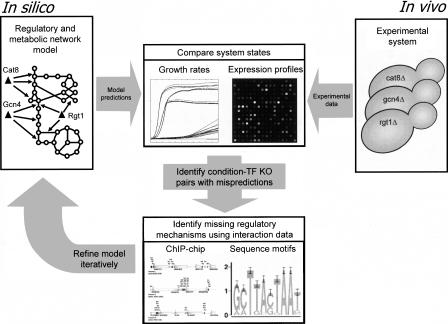
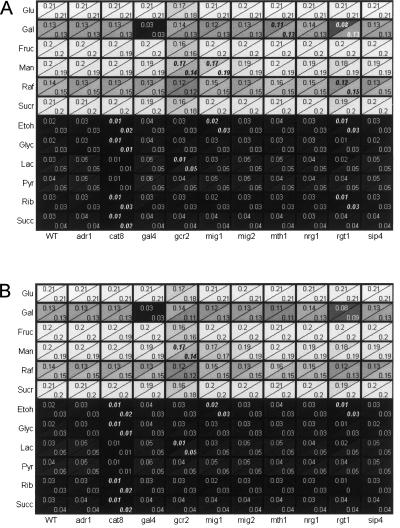
We describe the use of model-driven analysis of multiple data types relevant to transcriptional regulation of metabolism to discover novel regulatory mechanisms in Saccharomyces cerevisiae. We have reconstructed the nutrient-controlled transcriptional regulatory network controlling metabolism in S. cerevisiae consisting of 55 transcription factors regulating 750 metabolic genes, based on information in the primary literature. This reconstructed regulatory network coupled with an existing genome-scale metabolic network model allows in silico prediction of growth phenotypes of regulatory gene deletions as well as gene expression profiles. We compared model predictions of gene expression changes in response to genetic and environmental perturbations to experimental data to identify potential novel targets for transcription factors. We then identified regulatory cascades connecting transcription factors to the potential targets through a systematic model expansion strategy using published genome-wide chromatin immunoprecipitation and binding-site-motif data sets. Finally, we show the ability of an integrated metabolic and regulatory network model to predict growth phenotypes of transcription factor knockout strains. These studies illustrate the potential of model-driven data integration to systematically discover novel components and interactions in regulatory and metabolic networks in eukaryotic cells.
Figures


References
-
- Bussey H., Storms R.K., Ahmed A., Albermann K., Allen E., Ansorge W., Araujo R., Aparicio A., Barrell B., Badcock K., Storms R.K., Ahmed A., Albermann K., Allen E., Ansorge W., Araujo R., Aparicio A., Barrell B., Badcock K., Ahmed A., Albermann K., Allen E., Ansorge W., Araujo R., Aparicio A., Barrell B., Badcock K., Albermann K., Allen E., Ansorge W., Araujo R., Aparicio A., Barrell B., Badcock K., Allen E., Ansorge W., Araujo R., Aparicio A., Barrell B., Badcock K., Ansorge W., Araujo R., Aparicio A., Barrell B., Badcock K., Araujo R., Aparicio A., Barrell B., Badcock K., Aparicio A., Barrell B., Badcock K., Barrell B., Badcock K., Badcock K., et al. The nucleotide sequence of Saccharomyces cerevisiae chromosome XVI. Nature. 1997;387:103–105. - PubMed
-
- Christie K.R., Weng S., Balakrishnan R., Costanzo M.C., Dolinski K., Dwight S.S., Engel S.R., Feierbach B., Fisk D.G., Hirschman J.E., Weng S., Balakrishnan R., Costanzo M.C., Dolinski K., Dwight S.S., Engel S.R., Feierbach B., Fisk D.G., Hirschman J.E., Balakrishnan R., Costanzo M.C., Dolinski K., Dwight S.S., Engel S.R., Feierbach B., Fisk D.G., Hirschman J.E., Costanzo M.C., Dolinski K., Dwight S.S., Engel S.R., Feierbach B., Fisk D.G., Hirschman J.E., Dolinski K., Dwight S.S., Engel S.R., Feierbach B., Fisk D.G., Hirschman J.E., Dwight S.S., Engel S.R., Feierbach B., Fisk D.G., Hirschman J.E., Engel S.R., Feierbach B., Fisk D.G., Hirschman J.E., Feierbach B., Fisk D.G., Hirschman J.E., Fisk D.G., Hirschman J.E., Hirschman J.E., et al. Saccharomyces Genome Database (SGD) provides tools to identify and analyze sequences from Saccharomyces cerevisiae and related sequences from other organisms. Nucleic Acids Res. 2004;32:D311–D314. - PMC - PubMed
-
- Costanzo M.C., Crawford M.E., Hirschman J.E., Kranz J.E., Olsen P., Robertson L.S., Skrzypek M.S., Braun B.R., Hopkins K.L., Kondu P., Crawford M.E., Hirschman J.E., Kranz J.E., Olsen P., Robertson L.S., Skrzypek M.S., Braun B.R., Hopkins K.L., Kondu P., Hirschman J.E., Kranz J.E., Olsen P., Robertson L.S., Skrzypek M.S., Braun B.R., Hopkins K.L., Kondu P., Kranz J.E., Olsen P., Robertson L.S., Skrzypek M.S., Braun B.R., Hopkins K.L., Kondu P., Olsen P., Robertson L.S., Skrzypek M.S., Braun B.R., Hopkins K.L., Kondu P., Robertson L.S., Skrzypek M.S., Braun B.R., Hopkins K.L., Kondu P., Skrzypek M.S., Braun B.R., Hopkins K.L., Kondu P., Braun B.R., Hopkins K.L., Kondu P., Hopkins K.L., Kondu P., Kondu P., et al. YPD, PombePD and WormPD: Model organism volumes of the BioKnowledge library, an integrated resource for protein information. Nucleic Acids Res. 2001;29:75–79. - PMC - PubMed
Publication types
MeSH terms
Substances
Grants and funding
LinkOut - more resources
Full Text Sources
Molecular Biology Databases