Comparative Study
. 2006 May;16(5):606-17.
doi: 10.1101/gr.4515306. Epub 2006 Apr 10.

Conservation and functional significance of gene topology in the genome of Caenorhabditis elegans

Affiliations
Comparative Study

Conservation and functional significance of gene topology in the genome of Caenorhabditis elegans

Nansheng Chen et al. Genome Res. 2006 May.

Abstract

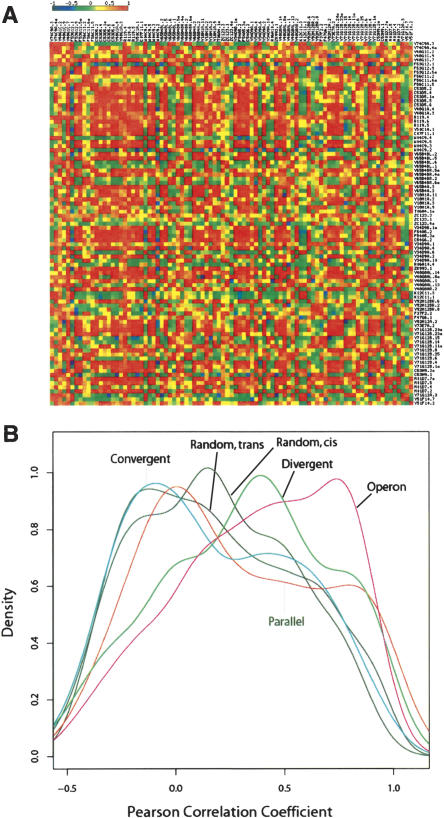
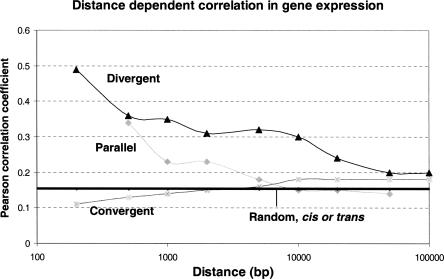
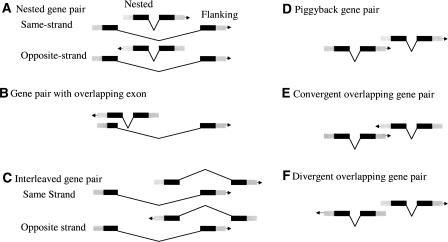
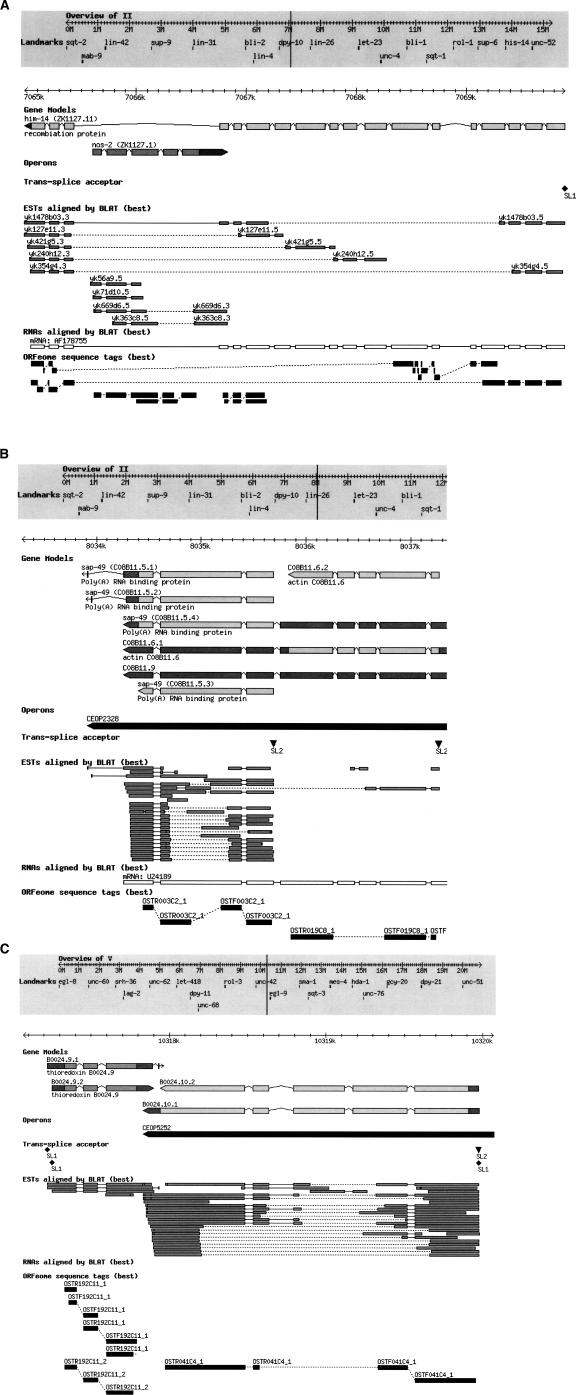
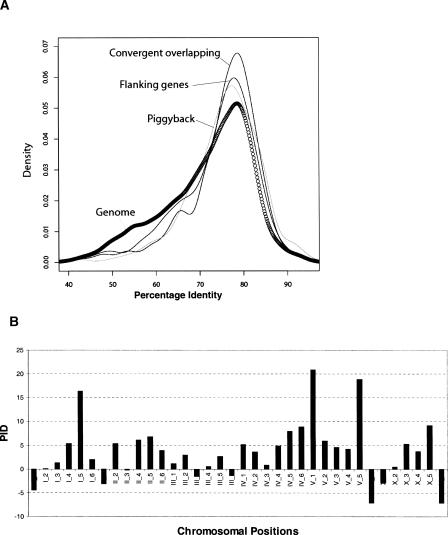
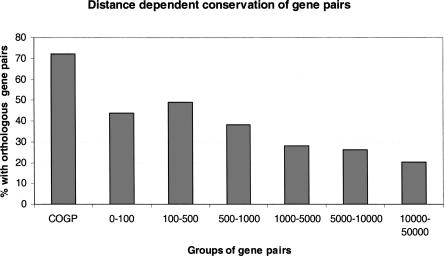
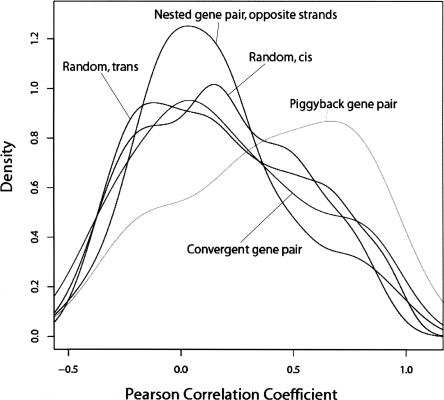
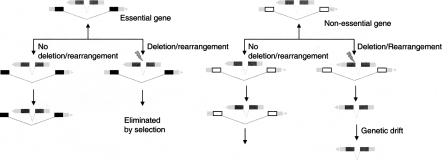
We have systematically examined the correlation between transcriptional expression pattern and the physical layout of gene pairs in the genome of Caenorhabditis elegans using a public tissue-specific SAGE library data set. We find a strong positive correlation in the expression patterns of neighboring gene pairs that are close together and transcribed in the same direction as well as for neighboring pairs that are located on opposing strands and transcribed in divergent directions. Coupling between members of nonoverlapping neighboring gene pairs is independent of operons and decreases to background levels as the distance increases beyond 10 kb. These findings suggest the existence of regional transcriptional domains in the C. elegans genome. In contrast, genes that are on opposing strands and transcribed in convergent directions are less transcriptionally coupled than the genome-wide background, suggesting a mutual inhibition mechanism. We have also examined the conservation and functional consequences of extreme cases of topological entanglement in the C. elegans genome, in which two or more genes physically overlap in their UTRs or coding regions. We have found that overlapping gene pairs are more conserved and are enriched in essential genes and genes that cause various defined phenotypes revealed by RNAi trials. SAGE analysis indicates that genes that are on the same strand, physically overlap, and transcript at the same directions are very highly correlated in gene expression, while overlapping gene pairs in which one member of the pair resides within an intron of the other are weakly, if at all, coupled, similar to convergent overlapping genes.


Figures

Figure 1.
Figure 1.
Correlation in gene expression. (A) A heat map that shows the correlation in gene expression for genes within the region 1–2 Mb on chromosome I. Each small box represents a pairwise Pearson correlation coefficient value that indicates the level of gene expression. (B) Distribution of Pearson correlation coefficient values calculated based on tissue-specific SAGE tags. (Parallel) Parallel gene pairs with distance between closest coding exons ≤1000 bp; (Divergent) divergent neighboring gene pairs with distance between closest coding exons ≤1000 bp; (Convergent) convergent neighboring gene pairs between closest coding exons ≤1000 bp; (Operon) gene pairs within operons; (Random cis) random gene pairs within same chromosomes; (Random trans) random gene pairs in which two genes are from different chromosomes.
Figure 2.
Figure 2.
Distance-dependent correlation in gene expression. x-axis is the distance between neighboring genes and y-axis is the Pearson correlation coefficient values. (Parallel) Parallel gene pairs; (Divergent) divergent neighboring gene pairs; (Convergent) convergent neighboring gene pairs. Each point in the figure represents a median value for the Pearson correlation coefficient for each group. Pearson correlation coefficient values for cis- and trans-random gene pairs are essentially the same and are represented by a horizontal line.
Figure 3.
Figure 3.
Types of overlapping. Six types of overlapping genes in C. elegans. (A) Nested gene pair, same strand. Each pair of nested gene consists of a flanking gene (outer gene) and a nested gene (inner gene). (B) Gene-pair group with overlapping exon, opposite strand. (C) Same-strand and opposite-strand interleaved gene pairs. (D) Piggyback gene pair. (E) Convergent overlapping gene pair. (F) Divergent overlapping gene group.
Figure 4.
Figure 4.
(A–C) Examples of overlapping genes. Generic genome browser (Stein et al. 2002) snapshots taken from the WormBase Web site. Six tracks are shown, i.e., Gene Models, Operons, Trans-splice acceptor, ESTs aligned by BLAT (best), RNAs aligned by BLAT (best), and ORFeome sequence tags (best). (A) Opposite-strand nested gene pairs; (B) Piggyback gene pair; (C) Convergent overlapping gene pairs.
Figure 5.
Figure 5.
Conservation of overlapping genes. (A) Distribution of protein percentage identity between C. elegans and C. briggsae orthologous for overlapping genes (piggyback, convergent overlapping genes, and flanking genes of the opposite-strand nested gene pairs) and genes in the whole C. elegans genome. (B) Gene conservation in different genomic divisions. Each chromosome (I, II, III, IV, V, X) is divided into six bins (e.g., I_1, I_2, . . . , X_5, X_6). Each bar represents the averaged protein percentage identity for overlapping genes subtracted by that of all other genes in the same bin. Positive bars indicate that overlapping genes are more conserved than the other genes.
Figure 6.
Figure 6.
Distance dependent conservation of overlapping gene pairs. Each bar represents the percentage of gene pairs in C. elegans that have orthologous gene pairs in C. briggsae. (COGP) Convergent overlapping gene pairs; (0–100) adjacent gene pairs in which two genes within a pair are separated by 0–100 bp genomic sequences; similarly, (100–500), (500–1000), (1000–5000), adjacent gene pairs in which two genes within a pair are separated by 100–500, 500–1000, 1000–5000, 5000–10,000, and 10,000–50,000-bp genomic sequences, respectively.
Figure 7.
Figure 7.
Expression coupling of overlapping genes. Distribution of Pearson correlation coefficient values for opposite-strand nested gene pairs, convergent overlapping gene pairs, piggyback gene pairs, and cis- and trans-random gene pairs.
Figure 8.
Figure 8.
Nested gene pairs. “Sheltered Island Model” exons are represented as boxes and introns are represented as lines. Exons of the essential genes are coded in black. Exons of the nonessential genes are represented as hollow boxes. UTRs are coded as light-gray boxes.

References

    1. Blumenthal T. Operons in eukaryotes. Brief Funct. Genomic Proteomic. 2004;3:199–211. - PubMed
    1. Blumenthal T., Evans D., Link C.D., Guffanti A., Lawson D., Thierry-Mieg J., Thierry-Mieg D., Chiu W.L., Duke K., Kiraly M., Evans D., Link C.D., Guffanti A., Lawson D., Thierry-Mieg J., Thierry-Mieg D., Chiu W.L., Duke K., Kiraly M., Link C.D., Guffanti A., Lawson D., Thierry-Mieg J., Thierry-Mieg D., Chiu W.L., Duke K., Kiraly M., Guffanti A., Lawson D., Thierry-Mieg J., Thierry-Mieg D., Chiu W.L., Duke K., Kiraly M., Lawson D., Thierry-Mieg J., Thierry-Mieg D., Chiu W.L., Duke K., Kiraly M., Thierry-Mieg J., Thierry-Mieg D., Chiu W.L., Duke K., Kiraly M., Thierry-Mieg D., Chiu W.L., Duke K., Kiraly M., Chiu W.L., Duke K., Kiraly M., Duke K., Kiraly M., Kiraly M., et al. A global analysis of Caenorhabditis elegans operons. Nature. 2002;417:851–854. - PubMed
    1. C. elegans Sequencing Consortium Genome sequence of the nematode C. elegans: A platform for investigating biology. Science. 1998;282:2012–2018. - PubMed
    1. Celniker S.E., Rubin G.M., Rubin G.M. The Drosophila melanogaster genome. Annu. Rev. Genomics Hum. Genet. 2003;4:89–117. - PubMed
    1. Chen N., Lawson D., Bradnam K., Harris T.W., Stein L.D., Lawson D., Bradnam K., Harris T.W., Stein L.D., Bradnam K., Harris T.W., Stein L.D., Harris T.W., Stein L.D., Stein L.D. WormBase as an integrated platform for the C. elegans ORFeome. Genome Res. 2004;14:2155–2161. - PMC - PubMed

Publication types

MeSH terms

Substances