. 2006 May;16(5):686-91.
doi: 10.1101/gr.4527806. Epub 2006 Apr 10.

Large-scale identification of protein-protein interaction of Escherichia coli K-12

Affiliations

Large-scale identification of protein-protein interaction of Escherichia coli K-12

Mohammad Arifuzzaman et al. Genome Res. 2006 May.

Abstract

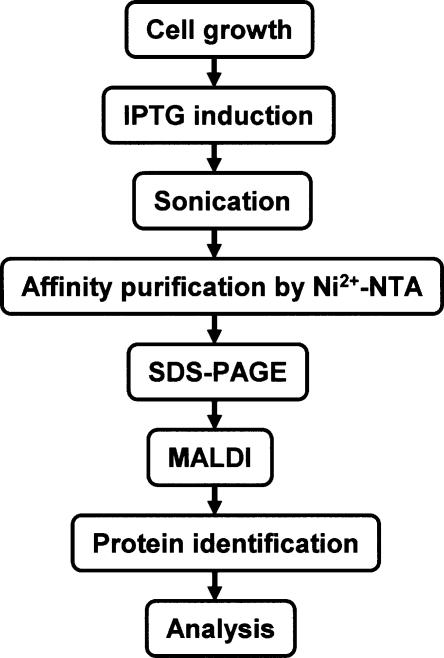
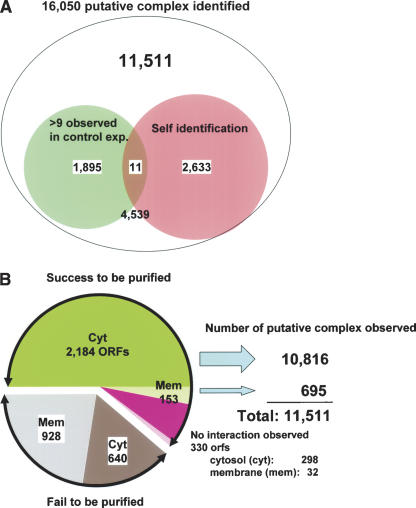
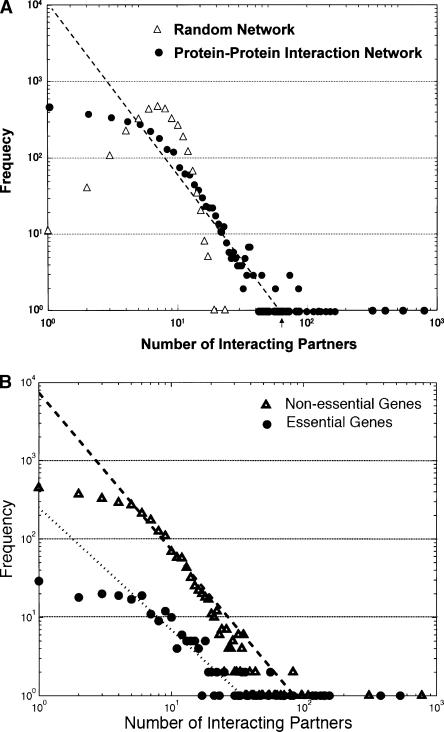
Protein-protein interactions play key roles in protein function and the structural organization of a cell. A thorough description of these interactions should facilitate elucidation of cellular activities, targeted-drug design, and whole cell engineering. A large-scale comprehensive pull-down assay was performed using a His-tagged Escherichia coli ORF clone library. Of 4339 bait proteins tested, partners were found for 2667, including 779 of unknown function. Proteins copurifying with hexahistidine-tagged baits on a Ni2+-NTA column were identified by MALDI-TOF MS (matrix-assisted laser desorption ionization time of flight mass spectrometry). An extended analysis of these interacting networks by bioinformatics and experimentation should provide new insights and novel strategies for E. coli systems biology.


Figures

Figure 1.
Figure 1.
Schematic representation of the sequential steps used for the purification and identification of PPIs (see Methods for details).
Figure 2.
Figure 2.
Statistics of putative protein–protein interaction in E. coli. (A) The top number represents the total protein–protein interaction identified in this study. Of the total interactions, the small left circle (pale green) represents the number of interactions with proteins that may have affinity to Ni2+-NTA resin based on our control experiments. The right circle (pale red) shows the number of prey proteins identified as the same protein as histidine-tagged bait protein, which include 11,511 for further analyses. Other 4539 interactions were excluded because their protein assignment was ambiguous. (B) Left: The green region represents the number of cytosolic bait proteins successfully purified. The pink region represents the number of purified bait proteins that had no protein–protein interaction partner. The gray region shows the bait proteins that we failed to purify. Hatched regions represent the baits predicted or known as membrane proteins. Right: Numbers represent the putative PPIs observed.
Figure 3.
Figure 3.
Topological properties of protein–protein interaction network. (A) The frequency of all interacting partner proteins. x-axis represents the number of protein partners and y-axis represents the frequency. Experimental results and random generation of protein pairs having the same numbers of interactions are plotted. (B) The comparison of the frequency of interacting partner proteins between essential and nonessential gene products.
Figure 4.
Figure 4.
Schematic diagram for extracting protein–protein interaction pairs using KEGG pathway clusters. ORFs were clustered using KEGG database and encircled as Pathway A and B. Protein–protein interactions within the same cluster may be more plausible than those between different clusters and are defined as belonging to a functional unit. Proteins with an unknown function or proteins outside of a certain cluster that shows more than two independent interactions with proteins in the same cluster may also be plausible and were defined as functional components as encircled and marked by arrows. Node and arc represent protein and interaction, respectively.
Figure 5.
Figure 5.
Subgraph of protein–protein interactions. (A) RNAP interacting protein network. Networks of proteins that interact directly (blue nodes) with each of the RNAP subunits, RpoA, RpoB, and RpoC (red nodes). (B) Molecular chaperone and their target network properties. Red nodes represent major chaperone proteins and blue nodes represent their targets. The largest cluster shows the GroL interaction network and the second largest one shows the network of DnaK.

References

    1. Baba T., Ara T., Hasegawa M., Takai Y., Okumura Y., Baba M., Datsenko K.A., Tomita M., Wanner B.L., Mori H., Ara T., Hasegawa M., Takai Y., Okumura Y., Baba M., Datsenko K.A., Tomita M., Wanner B.L., Mori H., Hasegawa M., Takai Y., Okumura Y., Baba M., Datsenko K.A., Tomita M., Wanner B.L., Mori H., Takai Y., Okumura Y., Baba M., Datsenko K.A., Tomita M., Wanner B.L., Mori H., Okumura Y., Baba M., Datsenko K.A., Tomita M., Wanner B.L., Mori H., Baba M., Datsenko K.A., Tomita M., Wanner B.L., Mori H., Datsenko K.A., Tomita M., Wanner B.L., Mori H., Tomita M., Wanner B.L., Mori H., Wanner B.L., Mori H., Mori H. Construction of Escherichia coli K-12 in-frame, single-gene knock-out mutants—the Keio collection. Mol. Syst. Biol. 2006 http://www.nature.com/msb/journal/v2/n1/full/msb4100050.html - PMC - PubMed
    1. Bader G.D., Hogue C.W., Hogue C.W. Analyzing yeast protein–protein interaction data obtained from different sources. Nat. Biotechnol. 2002;20:991–997. - PubMed
    1. Barabasi A.L., Albert R., Albert R. Emergence of scaling in random networks. Science. 1999;286:509–512. - PubMed
    1. Bell P.J., Andrews S.C., Sivak M.N., Guest J.R., Andrews S.C., Sivak M.N., Guest J.R., Sivak M.N., Guest J.R., Guest J.R. Nucleotide sequence of the FNR-regulated fumarase gene (fumB) of Escherichia coli K-12. J. Bacteriol. 1989;171:3494–3503. - PMC - PubMed
    1. Brandi A., Pon C.L., Gualerzi C.O., Pon C.L., Gualerzi C.O., Gualerzi C.O. Interaction of the main cold shock protein CS7.4 (CspA) of Escherichia coli with the promoter region of hns. Biochimie. 1994;76:1090–1098. - PubMed

MeSH terms

LinkOut - more resources