Comparative Study
. 2006 May;16(5):618-26.
doi: 10.1101/gr.4814006. Epub 2006 Apr 10.

Haplotype variation in structure and expression of a gene cluster associated with a quantitative trait locus for improved yield in rice

Affiliations
Comparative Study

Haplotype variation in structure and expression of a gene cluster associated with a quantitative trait locus for improved yield in rice

Guangming He et al. Genome Res. 2006 May.

Abstract

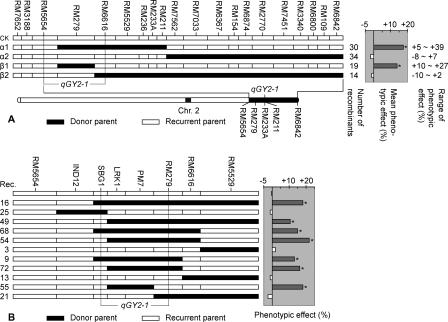
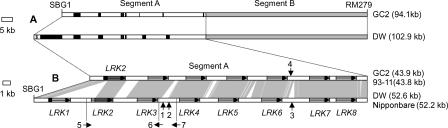
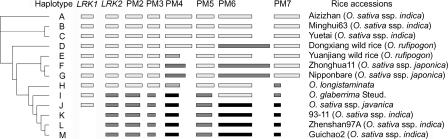
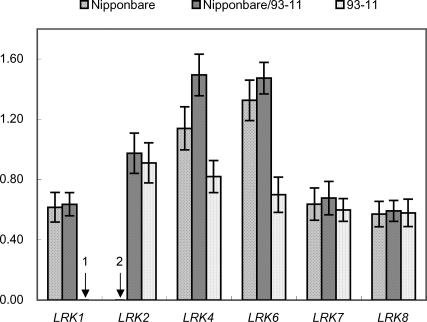
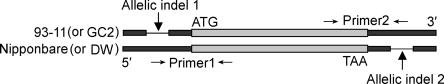
By constructing nearly isogenic lines (NILs) that differ only at a single quantitative trait locus (QTL), we fine-mapped the yield-improving QTL qGY2-1 to a 102.9-kb region on rice chromosome 2. Comparison analysis of the genomic sequences in the mapped QTL region between the donor (Dongxiang wild rice, Oryza rufipogon Griff.) and recurrent (Guichao2, Oryza sativa ssp. indica) parents used for the development of NILs identified the haplotypes of a leucine-rich repeat receptor kinase gene cluster, which showed extensive allelic variation. The sequences between genes in the cluster had a very high rate of divergence. More importantly, the genes themselves also differed between two haplotypes: Only 92% identity was observed for one allele, and another allele was found to have completely lost its allelic counterpart in Guichao2. The other six shared genes all showed >98% identity, and four of these exhibited obvious regulatory variation. The same haplotype segments also differed in length (43.9-kb in Guichao2 vs. 52.6-kb in Dongxiang wild rice). Such extensive sequence variation was also observed between orthologous regions of indica (cv. 93-11) and japonica (cv. Nipponbare) subspecies of Oryza sativa. Different rates of sequence divergence within the cluster have resulted in haplotype variability in 13 rice accessions. We also detected allelic expression variation in this gene cluster, in which some genes gave unequal expression of alleles in hybrids. These allelic variations in structure and expression suggest that the leucine-rich repeat receptor kinase gene cluster identified in our study should be a particularly good candidate for the source of the yield QTL.


Figures

Figure 1.
Figure 1.
Fine mapping and physical positioning of qGY2–1. (A) Phenotypic analysis of the recombination groups in the short arm of chromosome 2 near SSR marker RM233A. Each group is composed of families whose genotype is represented by a bar divided into black (Dongxiang wild rice, Oryza rufipogon) and empty (Guichao2, Oryza sativa ssp. indica) segments. The genomic composition of the α1, β1 group and α2, β2 group are, respectively, defined by the shortest and the longest O. rufipogon segments detected in the included recombinant families. The borders between bars are arbitrarily drawn midway between positive and negative markers for the introgressed O. rufipogon segment. To the right are the number of recombinants in the group, the mean phenotypic effect of the group, and the minimum and maximum effects in the included families. An asterisk indicates that the phenotypic effect of each of the included families was significant (P < 0.05). The genetically mapped interval of qGY2–1 is indicated by broken lines. (B) Genotypic and phenotypic analysis of 11 recombinant families. Asterisks in the right panel denote a significant phenotypic effect (P < 0.05). The physical location of qGY2–1 is indicated by a broken line between SBG1 and RM279.
Figure 2.
Figure 2.
Identification of the LRK gene cluster associated with the mapped QTL. (A) Schematic diagram of the sequence comparison in the QTL region flanked by the markers SBG1 and RM279 between Guichao2 (GC2) and Dongxiang wild rice (DW). Based on the extent of sequence divergence, the orthologous segment was divided into two sections. Segment B (represented by the lightly shaded rectangles) showed 99% sequence identity. The sequence of segment A exhibited extensive variation (represented by black bars or lines). (B) Sequence alignment of the LRK gene cluster in segment A between Guichao2 (or 93–11) and Dongxiang wild rice (or Nipponbare). Conserved sequences are connected by vertical areas. Horizontal arrows in shaded rectangles indicate polarity and position of LRK gene copies. Upward vertical arrows 1, 2, and 3 indicate position 337, 36, and 66-bp indels between Dongxiang wild rice and Nipponbare, respectively; downward vertical arrow 4 indicates the position of a 38-bp indel between Guichao2 and 93–11; horizontal arrows 5, 6, and 7 indicate polarity and the position of three gene fragments within the LRK cluster.
Figure 3.
Figure 3.
Haplotype diversity of the LRK gene cluster in 13 rice accessions. Based on the presence/absence of LRK1, the divergence of LRK2, and the sequence variation before the 5′ coding region of LRK2 to LRK7 (designated by PM2 to PM7), 13 haplotypes (A–M) were detected among 13 rice accessions. Different shaded rectangles indicate the size and sequence variation in the polymorphous regions. The small sequence variation within a size of 2 bp in the segments represented by the same rectangles are not shown in this figure. To the left is the phylogenic tree generated by ClustalX using the neighbor-joining method based on the divergent sequences in the LRK cluster.
Figure 4.
Figure 4.
Allelic expression variation of LRK genes in Nipponbare, 93–11, and their hybrid cross Nipponbare/93–11. Rice seedlings at the three-leaf stage were processed for the measurement of the transcript level using RT-PCR. Expression levels of LRK genes were evaluated relative to that of actin1. Error bars, standard deviation (SD). Vertical arrow 1 indicates loss of LRK1 in 93–11, and vertical arrow 2 indicates that transcript was not detected in Nipponbare.
Figure 5.
Figure 5.
Schematic diagram of designing primers used for allelic-specific expression analysis of LRK6. Two small allelic indels in the 5′ and 3′ noncoding regions of LRK6 were used for designing the allelic-specific primers. Lightly shaded rectangles, coding regions; darkly shaded rectangles, non-coding regions; black lines, allelic indels. Primer1, primer specific for Nipponbare (or Dongxiang wild rice, DW); Primer2, primer specific for 93–11 (or Guichao2, GC2). RT-PCR was performed using one allelic-specific primer and another primer derived from the coding region.

References

    1. Bennetzen J.L. Comparative sequence analysis of plant nuclear genomes: microcolinearity and its many exceptions. Plant Cell. 2000;12:1021–1029. - PMC - PubMed
    1. Birchler J.A., Auger D.L., Riddle N.C., Auger D.L., Riddle N.C., Riddle N.C. In search of the molecular basis of heterosis. Plant Cell. 2003;15:2236–2239. - PMC - PubMed
    1. Comeron J.M. K-Estimator: Calculation of the number of nucleotide substitutions per site and the confidence intervals. Bioinformatics. 1999;15:763–764. - PubMed
    1. Cowles C.R., Hirschhorn J.N., Altshuler D., Lander E.S., Hirschhorn J.N., Altshuler D., Lander E.S., Altshuler D., Lander E.S., Lander E.S. Detection of regulatory variation in mouse genes. Nat. Genet. 2002;32:432–437. - PubMed
    1. Doebley J., Stec A., Hubbard L., Stec A., Hubbard L., Hubbard L. The evolution of apical dominance in maize. Nature. 1997;386:485–488. - PubMed

Publication types

LinkOut - more resources