

Biologically relevant effects of mRNA amplification on gene expression profiles
- PMID: 16608515
- PMCID: PMC1523219
- DOI: 10.1186/1471-2105-7-200
Biologically relevant effects of mRNA amplification on gene expression profiles
Abstract
Background: Gene expression microarray technology permits the analysis of global gene expression profiles. The amount of sample needed limits the use of small excision biopsies and/or needle biopsies from human or animal tissues. Linear amplification techniques have been developed to increase the amount of sample derived cDNA. These amplified samples can be hybridised on microarrays. However, little information is available whether microarrays based on amplified and unamplified material yield comparable results. In the present study we compared microarray data obtained from amplified mRNA derived from biopsies of rat cardiac left ventricle and non-amplified mRNA derived from the same organ. Biopsies were linearly amplified to acquire enough material for a microarray experiment. Both amplified and unamplified samples were hybridized to the Rat Expression Set 230 Array of Affymetrix.
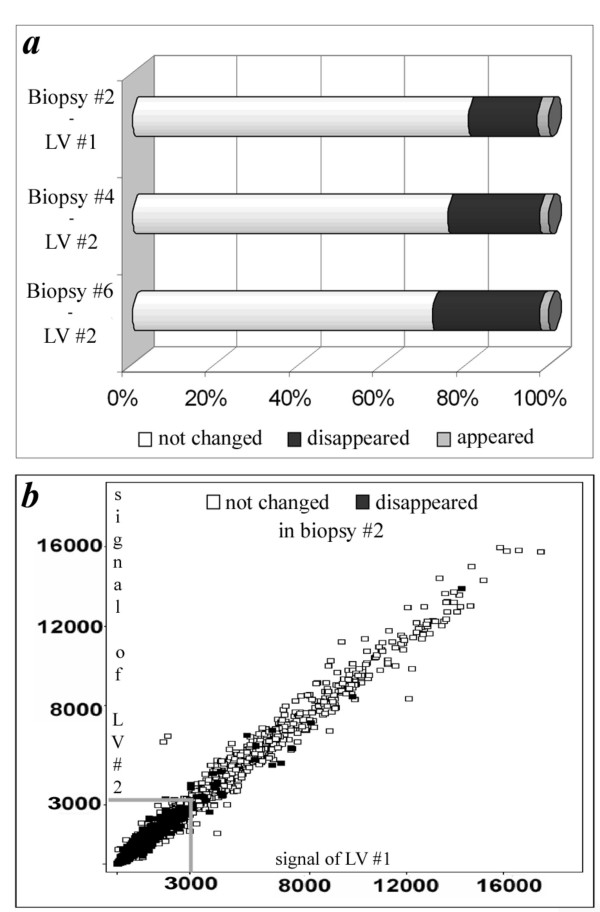
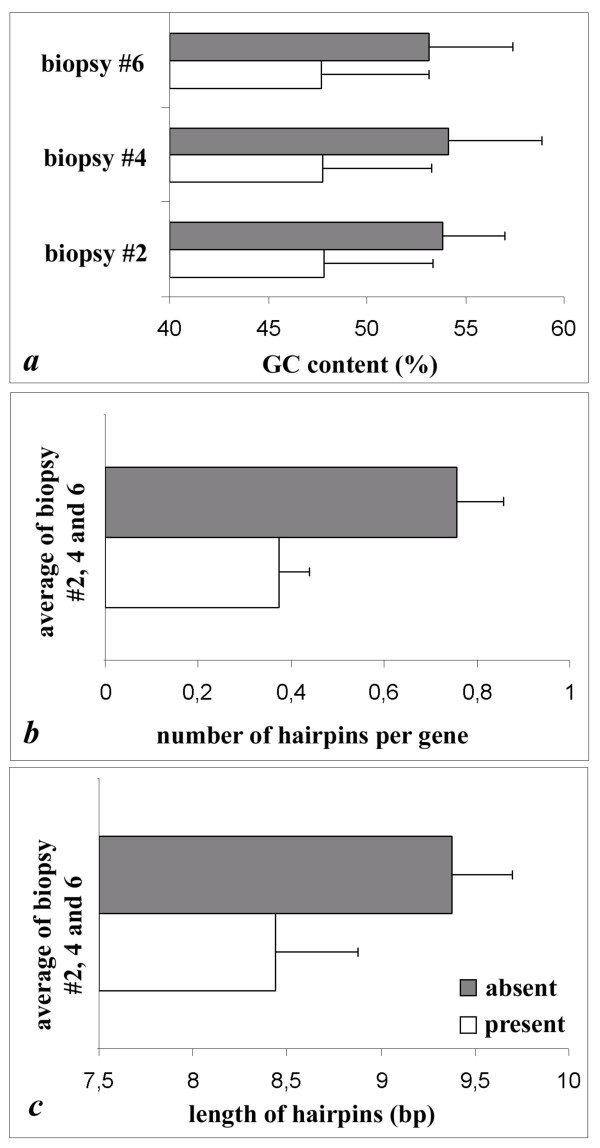
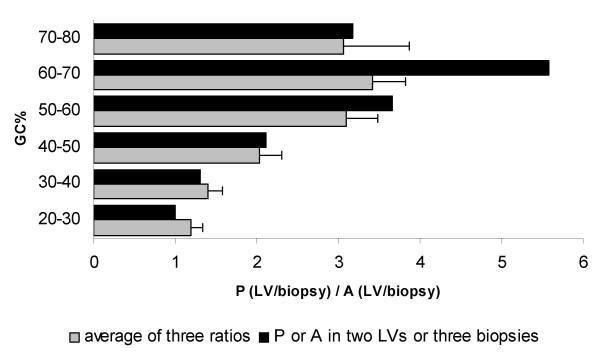
Results: Analysis of the microarray data showed that unamplified material of two different left ventricles had 99.6% identical gene expression. Gene expression patterns of two biopsies obtained from the same parental organ were 96.3% identical. Similarly, gene expression pattern of two biopsies from dissimilar organs were 92.8% identical to each other.Twenty-one percent of reporters called present in parental left ventricular tissue disappeared after amplification in the biopsies. Those reporters were predominantly seen in the low intensity range. Sequence analysis showed that reporters that disappeared after amplification had a GC-content of 53.7+/-4.0%, while reporters called present in biopsy- and whole LV-samples had an average GC content of 47.8+/-5.5% (P <0.001). Those reporters were also predicted to form significantly more (0.76+/-0.07 versus 0.38+/-0.1) and longer (9.4+/-0.3 versus 8.4+/-0.4) hairpins as compared to representative control reporters present before and after amplification.
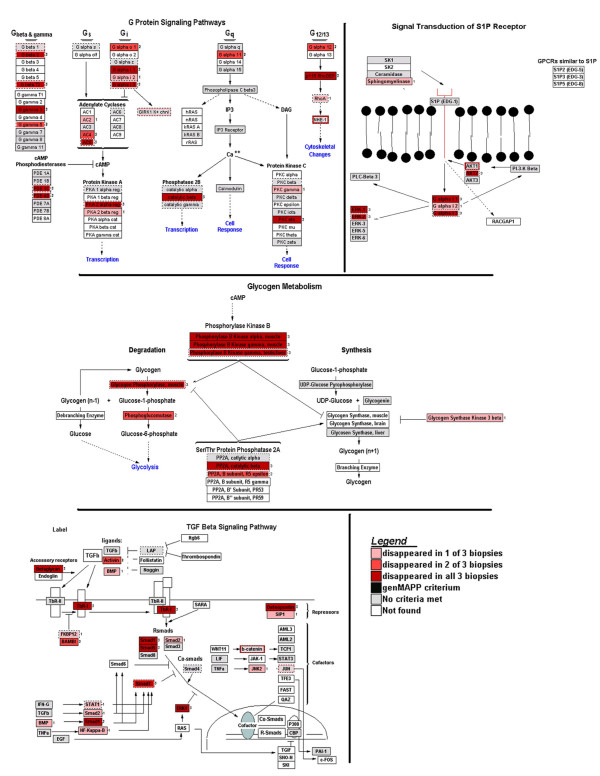
Conclusion: This study establishes that the gene expression profile obtained after amplification of mRNA of left ventricular biopsies is representative for the whole left ventricle of the rat heart. However, specific gene transcripts present in parental tissues were undetectable in the minute left ventricular biopsies. Transcripts that were lost due to the amplification process were not randomly distributed, but had higher GC-content and hairpins in the sequence and were mainly found in the lower intensity range which includes many transcription factors from specific signalling pathways.
Figures
Similar articles
-
Optimized T7 amplification system for microarray analysis.Biotechniques. 2001 Oct;31(4):874-9. doi: 10.2144/01314mt05. Biotechniques. 2001. PMID: 11680719
-
Validation and application of a high fidelity mRNA linear amplification procedure for profiling gene expression.Vet Immunol Immunopathol. 2005 May 15;105(3-4):331-42. doi: 10.1016/j.vetimm.2005.02.018. Vet Immunol Immunopathol. 2005. PMID: 15808310
-
Fidelity and enhanced sensitivity of differential transcription profiles following linear amplification of nanogram amounts of endothelial mRNA.Physiol Genomics. 2003 Apr 16;13(2):147-56. doi: 10.1152/physiolgenomics.00173.2002. Physiol Genomics. 2003. PMID: 12700361
-
Strategies for microarray analysis of limiting amounts of RNA.Brief Funct Genomic Proteomic. 2003 Apr;2(1):31-6. doi: 10.1093/bfgp/2.1.31. Brief Funct Genomic Proteomic. 2003. PMID: 15239941 Review.
-
Disease profiling arrays: reverse format cDNA arrays complimentary to microarrays.Adv Biochem Eng Biotechnol. 2004;86:191-213. doi: 10.1007/b12443. Adv Biochem Eng Biotechnol. 2004. PMID: 15088766 Review.
Cited by
-
The influence of cancer tissue sampling on the identification of cancer characteristics.Sci Rep. 2015 Oct 22;5:15474. doi: 10.1038/srep15474. Sci Rep. 2015. PMID: 26490514 Free PMC article.
-
Comparison of dorsal root ganglion gene expression in rat models of traumatic and HIV-associated neuropathic pain.Eur J Pain. 2009 Apr;13(4):387-98. doi: 10.1016/j.ejpain.2008.05.011. Epub 2008 Jul 7. Eur J Pain. 2009. PMID: 18606552 Free PMC article.
-
Technical analysis of cDNA microarrays.PLoS One. 2009;4(2):e4486. doi: 10.1371/journal.pone.0004486. Epub 2009 Feb 16. PLoS One. 2009. PMID: 19221589 Free PMC article.
-
Transcriptomic biomarkers for individual risk assessment in new-onset heart failure.Circulation. 2008 Jul 15;118(3):238-46. doi: 10.1161/CIRCULATIONAHA.107.756544. Epub 2008 Jun 30. Circulation. 2008. PMID: 18591436 Free PMC article.
-
Impact of sample acquisition and linear amplification on gene expression profiling of lung adenocarcinoma: laser capture micro-dissection cell-sampling versus bulk tissue-sampling.BMC Med Genomics. 2009 Mar 9;2:13. doi: 10.1186/1755-8794-2-13. BMC Med Genomics. 2009. PMID: 19272143 Free PMC article.
References
-
- Li J, Adams L, Schwartz SM, Bumgamer RE. RNA amplification, fidelity and reproducibility of expression profiling. C R Biol. 2003;326:1021–1030. - PubMed
-
- Polacek DC, Passerini AG, Shi C, Francesco NM, Manduchi E, Grant GR, Powell S, Bischof H, Winkler H, Stoeckert CJJ, Davies PF. Fidelity and enhanced sensitivity of differential transcription profiles following linear amplification of nanogram amounts of endothelial mRNA. Physiol Genomics. 2003;13:147–156. - PubMed
Publication types
MeSH terms
Substances
LinkOut - more resources
Full Text Sources
Other Literature Sources
Molecular Biology Databases
Miscellaneous
