. 2006 Apr 20;110(15):8151-7.
doi: 10.1021/jp0574145.

Diffusion of lipid-like single-molecule fluorophores in the cell membrane

Affiliations

Diffusion of lipid-like single-molecule fluorophores in the cell membrane

Stefanie Y Nishimura et al. J Phys Chem B. .

Abstract

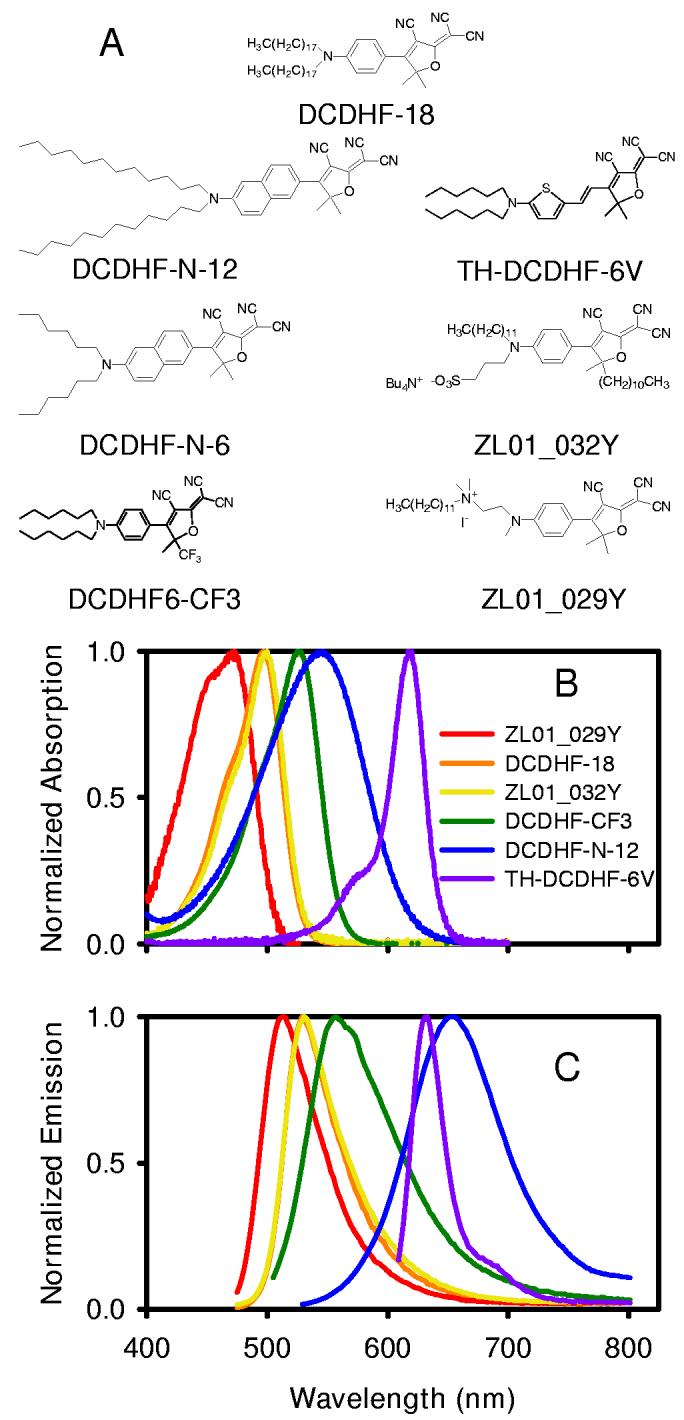
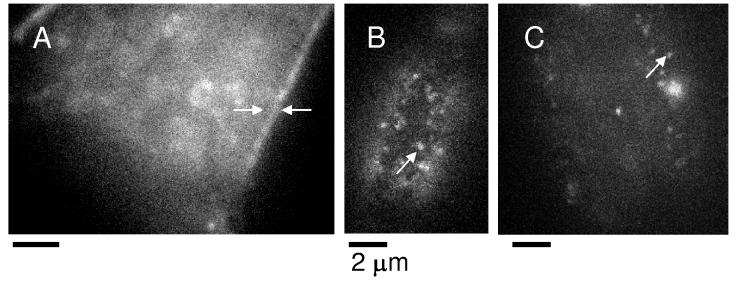
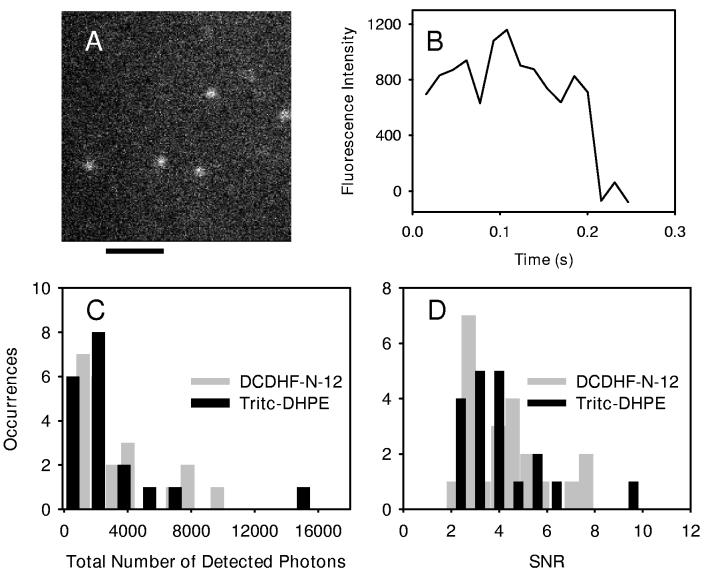
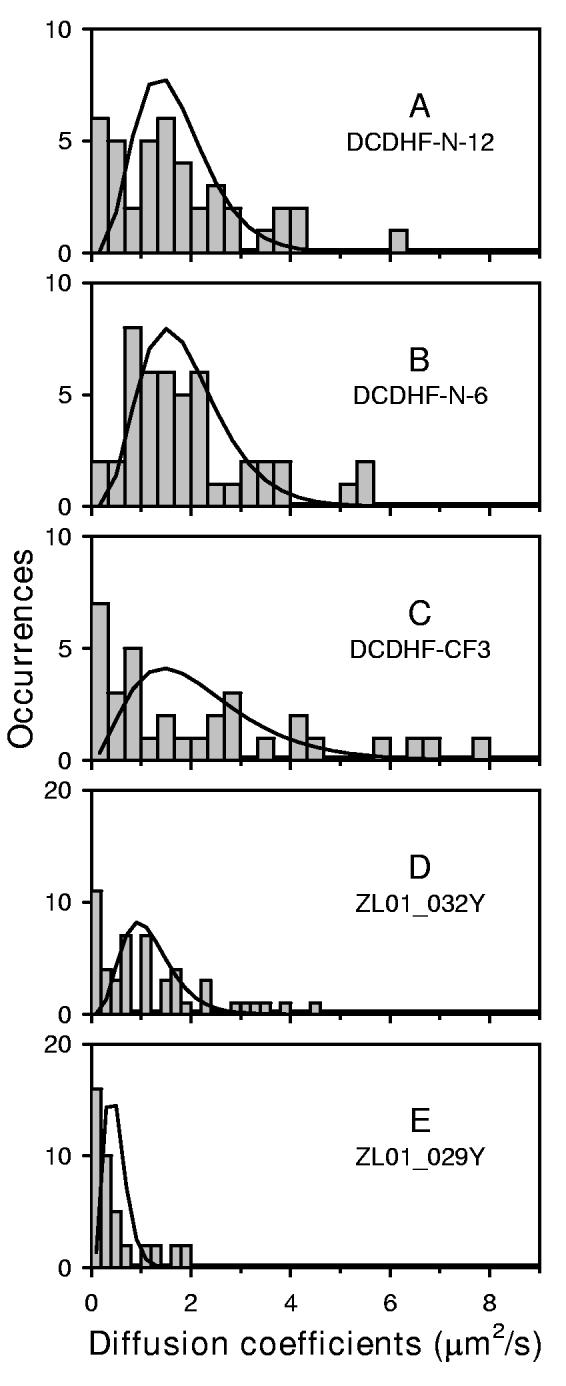
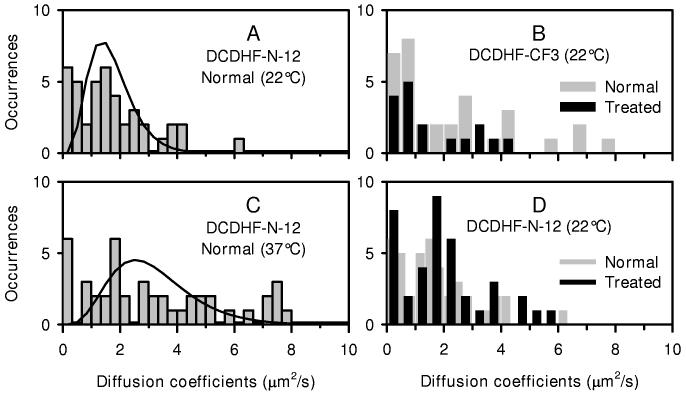
The dicyanomethylenedihydrofuran (DCDHF) class of single-molecule fluorophores contains an amine donor and a dicyanomethylenedihydrofuran acceptor linked by a conjugated unit (benzene, naphthalene, or styrene). Molecules in this class have a number of useful properties in addition to those usually required for single-molecule studies (such as high fluorescence quantum yield and photostability), including second-order optical nonlinearity, large ground-state dipole moment, and sensitivity to local environment. Moreover, most DCDHF molecules have amphiphilic structures, with a polar dicyanomethylenedihydrofuran headgroup and nonpolar hydrocarbon tails on the amine or furan ring, and can be used as fluorescent lipid analogues for live cell imaging. Here we demonstrate that individual molecules of several different DCDHF lipid analogues can be observed diffusing in the plasma membrane of Chinese hamster ovary cells. The photophysical and diffusive behaviors of the DCDHF lipid analogues in membranes are described and are found to be competitive with the well-known lipid probe N-(6-tetramethylrhodaminethiocarbamoyl)-1,2-dihexadecanoyl-sn-glycero-3-phosphoethanolamine.


Figures

Figure 1
Figure 1
DCDHF derivatives (A) Structures of DCDHF derivatives used in this study and their names. (B) Normalized absorption spectra for the DCDHF derivatives shown in A. (C) Normalized emission spectra for the DCDHF derivatives shown in A. The excitation wavelengths used to obtain the emission spectra are 460 nm for ZL01_029Y DCDHF-18, and ZL01_032Y, 488 nm for DCDHF-CF3, 514 nm for DCDHF-N-12, and 594 nm for TH-DCDHF-6V. All spectra were taken in ethanol. DCDHF-N-6 and DCDHF-N-12 have identical spectra, so only one is shown. The fluorescence spectrum of DCDHF-CF3 exhibits a small shoulder, which we attribute to poor solubility in ethanol.
Figure 2
Figure 2
Representative images of DCDHF molecules in the plasma membrane. (A) Cross-sectional image of DCDHF-18 at a higher concentration in the CHO cell. Cells were incubated with egg PC vesicles containing ∼10 mole % DCDHF-18. At these higher concentrations, DCDHF molecules labeled both the plasma membrane and internal cellular structures. (B) TH-DCDHF-6V at a single-molecule concentration in the plasma membrane of the upper cell surface. Cells were incubated with egg PC vesicles containing ∼3 mole % TH-DCDHF-6V. (C) Representative cross-sectional image of the CHO cell labeled with the egg PC vesicles containing ∼3 mole % DCDHF-N-12. DCDHF derivatives are preferentially localized to the plasma membrane at lower labeling concentrations. Scale bars represent 2 μm.
Figure 3
Figure 3
Comparison of DCDHF-N-12 with a rhodamine derivative Scale bar represents 2 μm. (A) Representative image of individual ZL01_029Y in the apical plasma membrane. ZL01_029Y was excited with 514 nm and imaged with an integration time of 15.4 ms per frame. (B) The integrated fluorescence intensity from a single molecule of DCDHF-N-12 as a function of time. (C) Histogram of the total number of detected photons for DCDHF-N-12 (22 molecules) as compared to Tritc-DHPE (19 molecules). (D) Histogram of signal-to-noise ratios for DCDHF-N-12 (22 molecules) as compared to Tritc-DHPE (19 molecules).
Figure 4
Figure 4
Distribution of diffusion coefficients for DCDHF derivatives The diffusion of these DCDHF molecules was observed at room temperature (22°C) with an integration time of 15.4 ms per frame, with the exception of DCDHF-CF3 which was imaged with an integration time of 10.7 ms per frame. DCDHF-N-12, DCDHF-N-6, and DCDHF-CF3 were pumped at 532 nm. ZL01_032Y and ZL01_029Y were excited at 514 nm. The trajectories were clipped to be 10 steps long (11 frames) for all derivatives except DCDHF-CF3 where 6 steps were used. The mean diffusion coefficient (obtained from each distribution of observed diffusion coefficients) used to calculate the expected homogeneous distribution (solid line) is given. (A) DCDHF-N-12 had a Dmean = 1.3 μm2/s from 41 trajectories. (B) DCDHF-N-6 had a Dmean = 1.5 μm2/s from 46 trajectories. (C) DCDHF-CF3 had a Dmean = 1.7 μm2/s from 33 trajectories. (D) Zl01_032Y had a Dmean = 0.9 μm2/s from 49 trajectories. (E) ZL01_029Y had a Dmean = 0.4 μm2/s from 41 trajectories.
Figure 5
Figure 5
Effect of temperature and cholesterol/sphingomyelin depletion. Histograms of diffusion coefficients for DCDHF-N-12 taken at 22°C and 37°C are shown in A and C. Histograms of diffusion coefficients for DCDHF-CF3 and DCDHF-N-12 taken before and after a dual treatment of 10 min sphingomyelinase followed by 10 min β-cyclodextrin are shown in B and D. The expected homogeneous distributions are not shown for space considerations. (A) DCDHF-N-12 at normal cholesterol concentration and 22°C. Details are given in the caption for Figure 4. (B) The distribution of diffusion coefficients for DCDHF-CF3 taken before (gray bars, details in Fig. 4) and after dual treatment (black bars). The mean diffusion coefficient for DCDHF-CF3 after the dual treatment was 1.2 μm2/s when imaged at 22°C. 17 tracks, clipped to be 7 frames long, were used in the analysis. The integration time was 10.7 ms per frame. (C) DCDHF-N-12 at normal cholesterol concentration imaged at 37°C. An integration time of 15.4 ms per frame was used. (D) The distribution of diffusion coefficients for DCDHF-N-12 taken before (gray bars, details in Fig. 4) and after dual treatment (black bars). The mean diffusion coefficient for DCDHF-N-12 after the dual treatment was 1.6 μm2/s when imaged at 22°C. The 39 tracks used in the analysis were clipped to be 11 frames long. The integration time was 15.4 ms per frame.

Similar articles

Cited by

References

    1. Brown DA, London E. Ann. Rev. Cell & Dev. Bio. 1998;14:111–136. - PubMed
    1. Anderson RGW, Jacobson K. Science. 2002;296:1821–1825. - PubMed
    1. Edidin M. Annu. Rev. Biophys. Biomol. Struct. 2003;32:257–283. - PubMed
    1. Lagerholm BC, Weinreb GE, Jacobson K, Thompson NL. Annual Review of Physical Chemistry. 2005;56:309–336. - PubMed
    1. Schmidt T, Schutz GJ, Baumgartner W, Gruber HJ, Schindler H. J. Phys. Chem. 1995;99:17662–17668.

Publication types