

Indications for propensity scores and review of their use in pharmacoepidemiology
- PMID: 16611199
- PMCID: PMC1790968
- DOI: 10.1111/j.1742-7843.2006.pto_293.x
Indications for propensity scores and review of their use in pharmacoepidemiology
Abstract
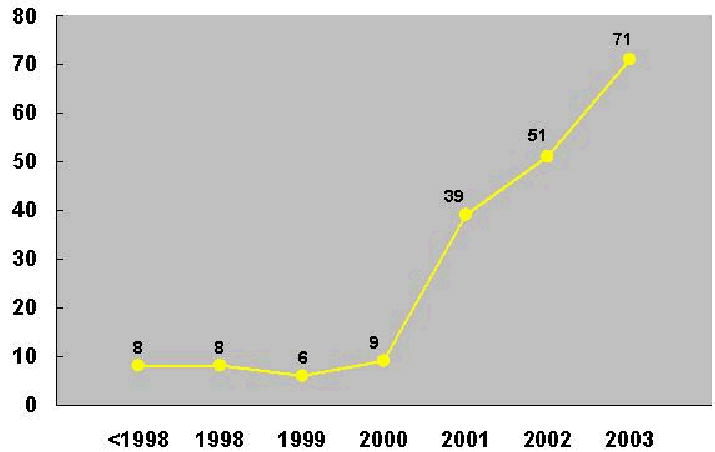
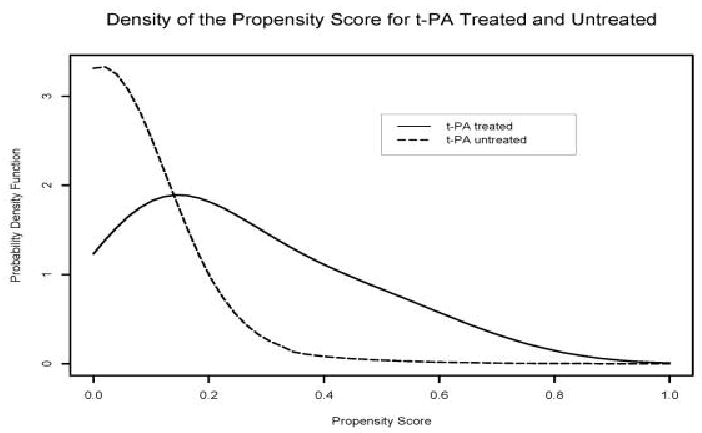
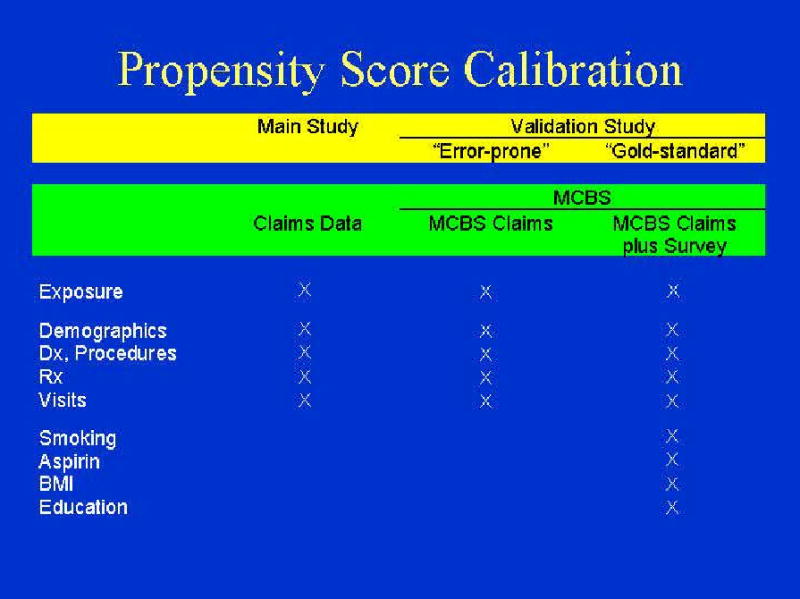
Use of propensity scores to identify and control for confounding in observational studies that relate medications to outcomes has increased substantially in recent years. However, it remains unclear whether, and if so when, use of propensity scores provides estimates of drug effects that are less biased than those obtained from conventional multivariate models. In the great majority of published studies that have used both approaches, estimated effects from propensity score and regression methods have been similar. Simulation studies further suggest comparable performance of the two approaches in many settings. We discuss five reasons that favour use of propensity scores: the value of focus on indications for drug use; optimal matching strategies from alternative designs; improved control of confounding with scarce outcomes; ability to identify interactions between propensity of treatment and drug effects on outcomes; and correction for unobserved confounders via propensity score calibration. We describe alternative approaches to estimate and implement propensity scores and the limitations of the C-statistic for evaluation. Use of propensity scores will not correct biases from unmeasured confounders, but can aid in understanding determinants of drug use and lead to improved estimates of drug effects in some settings.
Figures

References
-
- Joffe MM, Rosenbaum PR. Invited commentary: propensity scores. Am J Epidemiol. 1999;150:327–333. - PubMed
-
- Drake C. Effects of misspecification of the propensity score on estimators of treatment effect. Biometrics. 1993;49:1231–1236.
-
- Miettinen OS. Stratification by a multivariate confounder score. Am J Epidemiol. 1976;104:609–620. - PubMed
-
- Ray WA, Stein CM, Hall K, Daugherty JR, Griffin MR. Non-steroidal anti-inflammatory drugs and risk of serious coronary heart disease: an observational cohort study. Lancet. 2002;359:118–123. - PubMed
Publication types
MeSH terms
Grants and funding
LinkOut - more resources
Full Text Sources
Medical
